In a market like this, there’s only so much the charts can tell an investor.

Support for any individual name is not going to hold when the S&P 500 declines 7.6%, as it did on Monday — its worst one-day performance since December 2008.
For the entire energy sector, for instance, even long-term charts offer little in the way of guidance. From at least one perspective the group is back where it was 20 years ago. In terms of share price, that’s almost exactly true for Exxon Mobil (NYSE:XOM), whose stock now has gained less than 4%, total, over the past two decades.
In fact, of over 1,600 stocks with a market capitalization over $2 billion, the 25 worst performers on Monday all come from the energy sector. Each of the 25 declined at least 29% as oil prices plunged after Saudi Arabia started “an all-out price war” over the weekend.
Incredibly, of those 1,600-plus names, a smaller number — just 24 — closed in the green on Monday than fell 29% or more. This looks like panic selling, pure and simple, and that kind of movement generally won’t follow pattern trading.
In that context, after such a brutal day, Tuesday’s big stock charts focus on three of those 24 stocks that managed to buck the trend. In this market, it’s worth considering where even modest strength comes from. And with overnight futures suggesting a rebound, perhaps these three stocks can light the way to more stable trading.
O’Reilly Automotive (ORLY)
While markets plunged, O’Reilly Automotive (NASDAQ:ORLY) did manage to find support and eke out a reasonable gain. But unsurprisingly, the first of Tuesday’s big stock charts still suggests some caution:
- Again, the good news is that support has held in a market where support has been hard to find. But there’s still work left to do. A “death cross” looms as the 50-day moving average is set to cross under the 200-day in the next few sessions. Rallies going back to January have faltered short of the 20DMA. Stabilization is a step in the right direction, but there’s still a risk that support will break.
-
Click to EnlargeSource: Provided by FinvizLooking at the weekly chart, the news is a bit better. $360 clearly is a key level, as it provided resistance in late 2018. The reversion to support in 2020 from resistance in 2018 is bullish. Interestingly, ORLY stock held up as broad markets plunged.
- One key reason is that auto parts retailers like O’Reilly should benefit from plunging oil prices. Indeed, peers rallied Monday as well. AutoZone (NYSE:AZO) gained 5% and Advance Auto Parts (NYSE:AAP) rose 2%.
- And so there’s a bit of a countercyclical benefit for these retailers. The question is if support can drive a rally without a V-shaped recovery in the broad market. The hope would be that the sector is headed for a ‘Goldilocks’ scenario, in which the economy holds up well enough to keep spending intact but crude doesn’t see a snapback rally. For now, shareholders in the group can at least take solace in avoiding the worst of Monday’s rout.

Yum China (YUMC)
Yum China (NYSE:YUMC) might be the most surprising of Monday’s winners. Regardless, the second of our big stock charts does suggest some reason for optimism:
- Like ORLY, YUMC is mostly holding up amid challenging trading. And what’s particularly bullish about Monday’s trading is that investors bought the dip. The stock opened down 4%, and modestly below January support. Yet it closed in the green and at the high on reasonably significant volume. That shows significant strength.
-
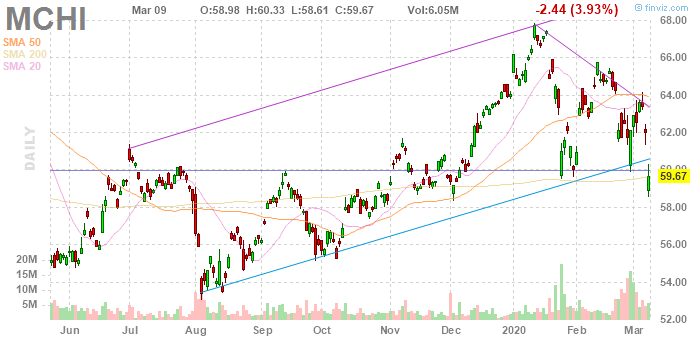
Click to EnlargeSource: Provided by FinvizThat’s particularly true given that Chinese stocks as a whole struggled on Monday. The iShares MSCI China ETF (NASDAQ:MCHI) closed down nearly 4%. MCHI did not post much of an intraday rally, though it did gain almost 2% from morning lows. That ETF, too, has been surprisingly strong but dipped below support. YUMC’s relative strength adds to the sense that Monday’s trading is meaningful.
- Fundamentally, the case for YUMC looks a bit dicier. Shares still trade at 21x next year’s consensus earnings estimate — not quite a value play. But, at least for now, investors are willing to pay up for what they see as a quality name even in a market set up to punish it.
Cabot Oil & Gas (COG)
Based on its name, Cabot Oil & Gas (NYSE:COG) seems like a downright bizarre winner on Monday. But the gains make some sense, and the third of Tuesday’s big stock charts raises hopes that more could be on the way:
- Technically, the recent move unquestionably is bullish. Shares made a textbook reversal out of a narrowing descending wedge. They retook support that held back in August and again late last year. The one concern is the late-session fade — COG dropped 10% from intraday highs — but shares did recapture some of those losses in after-hours trading.
- The reason Cabot Oil & Gas stock rallied is simple: despite its name, Cabot doesn’t actually produce oil anymore. And as Barron’s noted on Monday, the collapse in crude raised hopes that shale oil producers would reduce their gas output — providing a boost to plunging natural gas prices.
- That said, there’s still downside risk here both technically and fundamentally. Just last week, I highlighted COG stock as one of three intriguing plays for natural gas plays. The other two — Antero Midstream (NYSE:AM) and Cheniere Energy (NYSEAMERICAN:LNG) — were not so lucky on Monday, dropping 22% and 18%, respectively. It remains to be seen whether natural gas optimism can read across to those two names at some point, or if COG’s rally on Monday proves to be short-lived.
Vince Martin has covered the financial industry for close to a decade for InvestorPlace.com and other outlets. As of this writing, he has no positions in any securities mentioned.