It’s been a pretty wild and interesting fourth quarter for the stock market. Growth stocks are in the toilet, tech is trying to hold up and the S&P 500 is standing strong. Cryptocurrencies are swooning and the stock charts are all over the place.
Some charts show robust strength as the market tries to push to its highs. Others are flashing warning signs like we haven’t seen in years.
Making everything more difficult is tax-loss selling, the Federal Reserve’s more hawkish approach to its policy, high inflation and the omicron variant.
Amid it all, we’re trying to find some of the best-looking stock charts out there as we head into the holiday-shortened trading week. The hope is that these winners — those showing relative strength vs. its peers and the overall market — can continue to churn out strong gains.
Here are some of the names worth watching:
- Pfizer (NYSE:PFE)
- Nvidia (NASDAQ:NVDA)
- Apple (NASDAQ:AAPL)
- Broadcom (NASDAQ:AVGO)
- Procter & Gamble (NYSE:PG)
- UnitedHealth Group (NYSE:UNH)
- AbbVie (NYSE:ABBV)
Top Stock Charts: Pfizer (PFE)

Click to Enlarge
I have been pretty happy with the performance of Pfizer lately. On Dec. 13, I had this one listed as a top pick, looking for a daily-up rotation over $52.85. However, bulls got a lot more than they bargained for.
At the time, I was looking for the upside trigger to potentially send Pfizer up to $55. Instead, it ripped to new all-time highs and cleared $60. What an impressive couple of trading sessions!
From here, we have inside Doji day, which could indicate some indecision. Obviously, the new omicron variant has acted as a catalyst for this vaccine stock, but that makes it susceptible to the headlines. That’s a risk for traders.
Now we’re looking for a move over last week’s high near $61.50, which opens the door to the $62.50 to $63 area and where Pfizer finds its two-times range extension. Above that and the 261.8% extension could eventually be in play.
On a dip below $58.60, we could revisit the $55 breakout area and the 10-day moving average.
Top Stock Charts: Nvidia (NVDA)
Click to Enlarge
There’s a very strange disparity in tech stocks right now. Those deemed to be high-growth are being put through the shredder. In 99 out of 100 cases, it doesn’t matter whether it’s high quality or not.
Nvidia is an exception and it’s likely because it’s considered a “safe growth stock.”
It’s one of a handful of names I believe could be next to hit a $1 trillion market capitalization, although its recent surge makes that a lot more believable.
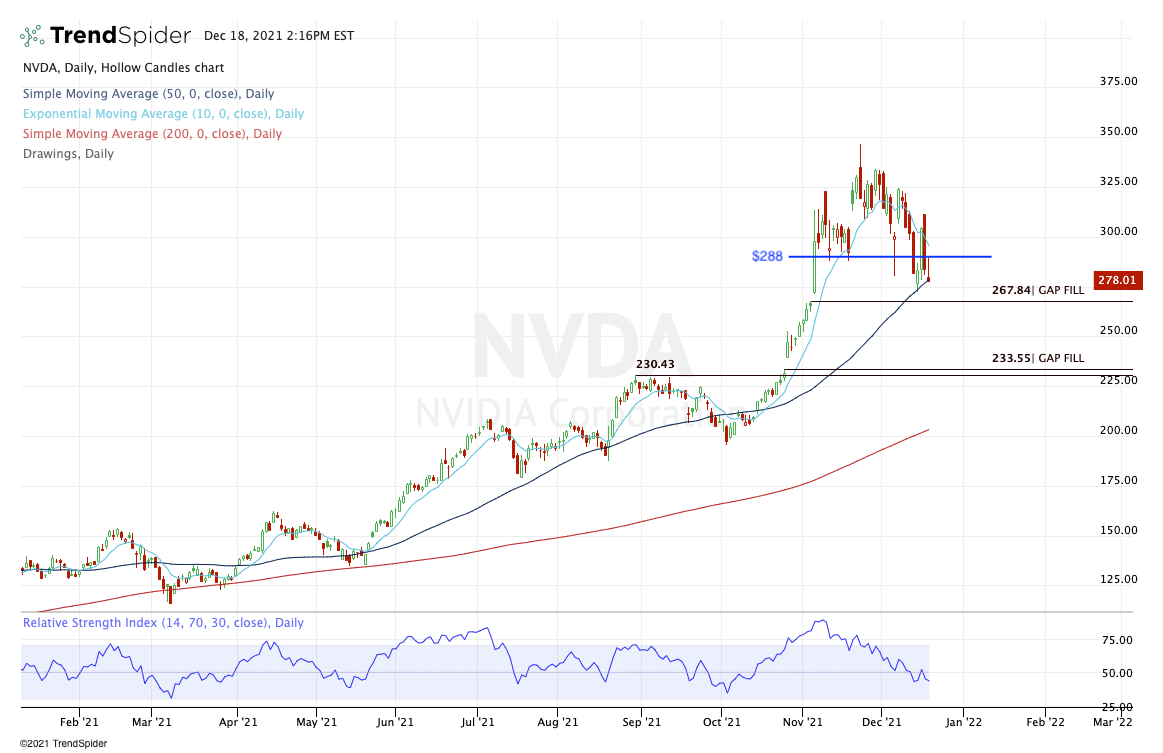
Nvidia has been a beast, up 140% from this year’s low (despite the recent pullback). The stock is giving us a wide and somewhat volatile bull flag consolidation, as it pulls back to its 50-day moving average.
Further weakness here could put the gap-fill in play near $268. Otherwise, let’s see if we can get a rotation over the $288 area, highlighted with a blue line. With a close above $300, Nvidia could make another run to the highs.
While Nvidia can always lose momentum, it has been one of the best-performing large-cap tech stocks.
Top Stock Charts: Apple (AAPL)
Click to Enlarge
Another monster performer lately is Apple. Regardless of what reports come out about the company’s iPhone, the stock simply continues to chug higher.
It’s no surprise, either.
Apple has robust financials, solid growth and profitability, and one of the most impressive business models I have ever seen. The company sells expensive products at an industry-leading price, then uses those devices to generate services revenue at twice the margin.
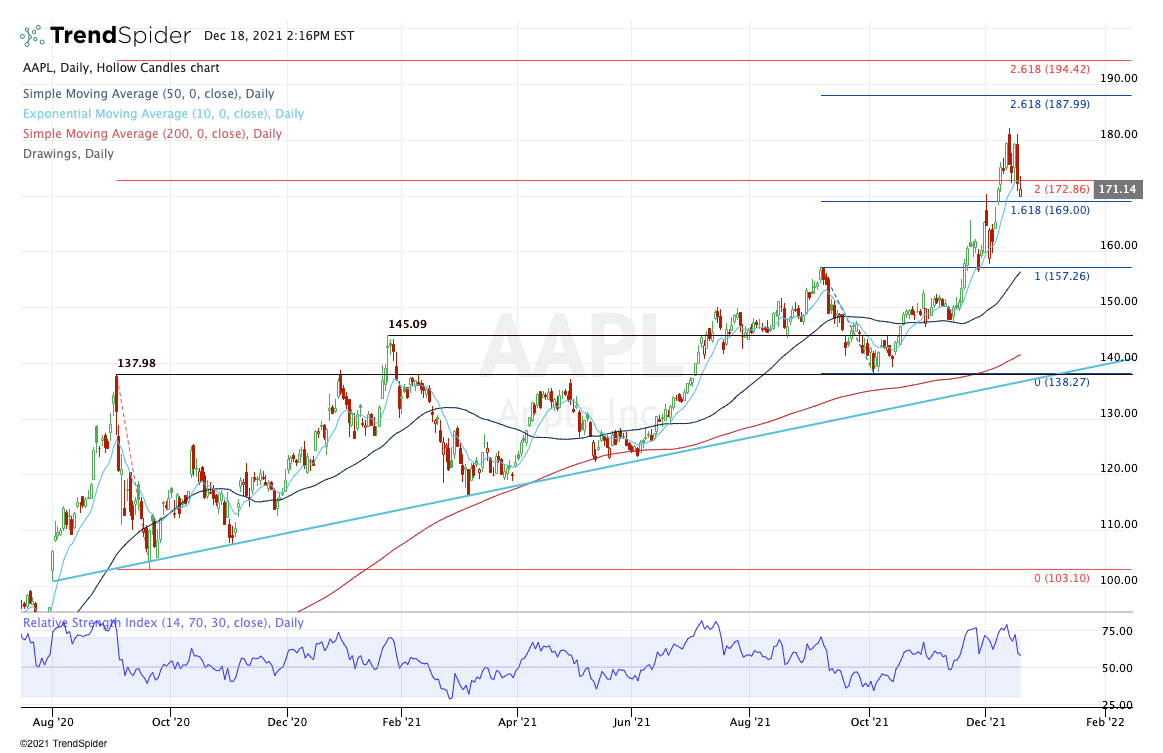
Fresh off all-time highs, Apple stock is starting to wobble a bit.
It wouldn’t be the end of the world to get a dip down to the $157 to $160 breakout area, along with the 50-day moving average. Will we get it? I don’t know, as the bulls could easily step in earlier. However, it would be a solid buying opportunity.
Either way, as long as the trend continues higher, the next set of extensions could be in play between $188 and $194. Above that and the obvious is in play: $200.
Top Stock Charts: Broadcom (AVGO)

Click to Enlarge
Broadcom is going to be the last of the tech stocks on this list. It’s been a shockingly quiet stretch for tech, as the Nasdaq lags the S&P 500 and as the Ark Innovation Fund (NYSEARCA:ARKK) tries to keep its head above water.
One stock not struggling with the same problem is Broadcom.
Shares just gave investors a pretty tight inside week and continue to hold the post-earnings gains. That’s pretty impressive given the wobbling in the overall market over the past week.
Should Broadcom lose last week’s low at ~$605.50 and the 10-day moving average, it could put the $590 gap-fill area in play, along with the 21-day moving average.
If we get an inside-and-up weekly rotation that doesn’t fail, $650-plus is in play and potentially $700 down the road.
Procter & Gamble (PG)
Click to Enlarge
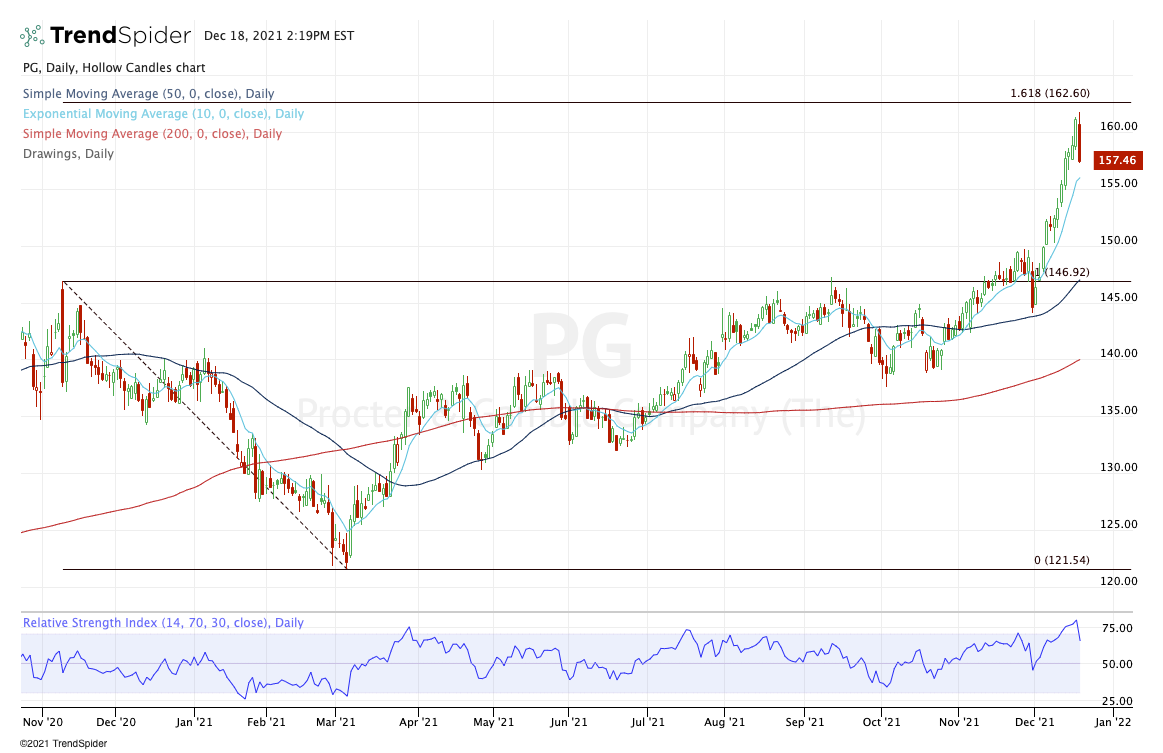
Like Pfizer, I have been behind P&G for a while now. While it’s not the sexiest pick on the list, the stock simply continues to churn its way higher.
On Friday Dec. 17, the stock tagged a new high before finally reversing lower. Coming into the session, shares had rallied in 11 of the prior 12 days.
From here, it’s pretty simple.
Let’s see if shares can hold short-term trend support at the 10-day moving average. To me, it’s worth taking a shot on stocks like this on a dip when the trend has been so overwhelmingly in favor of the bulls.
If the 10-day moving average fails as support, we may get some further consolidation. However, a buy-the-dip scenario that holds could put the 161.8% extension and new highs on the table.
UnitedHealth Group (UNH)
Click to Enlarge
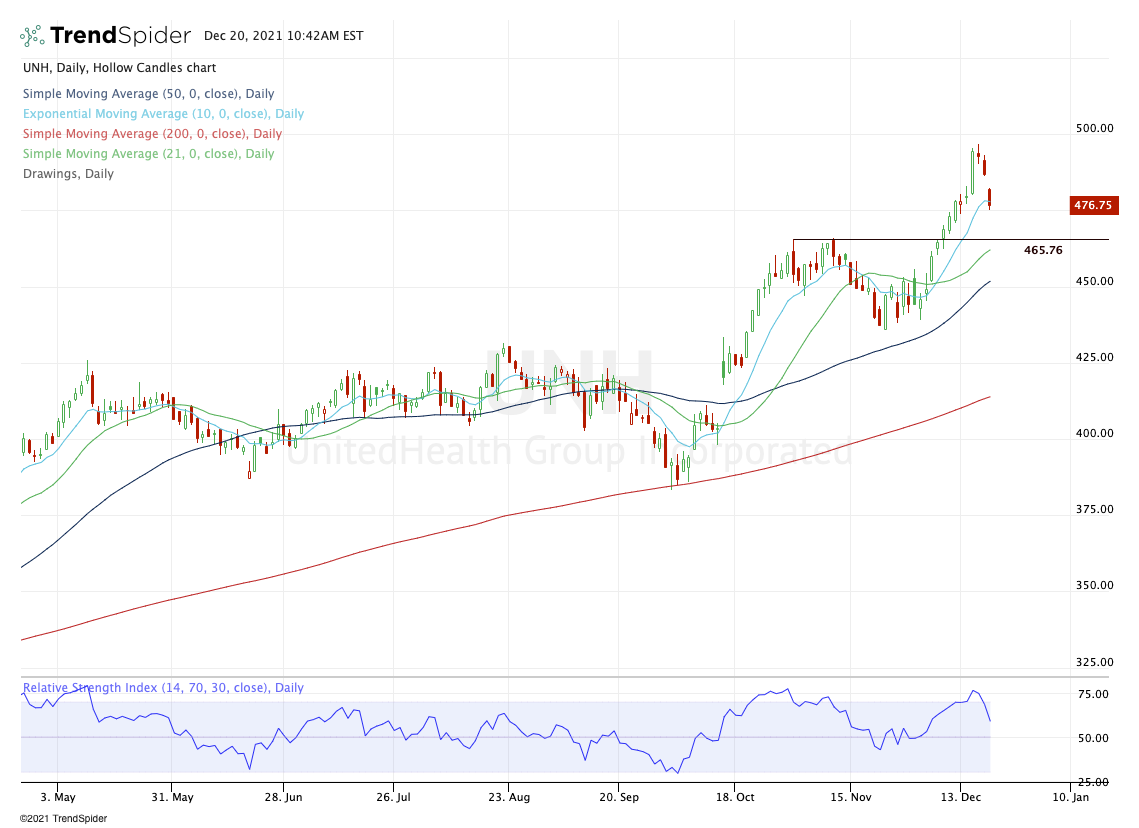
Like P&G, UnitedHealth has been on a stellar run lately. That’s got investors looking to buy the dip.
Not only does a buy-the-dip setup put investors in position for a potential bounce, but it could also send the stock to new highs. Of course, the risk is that shares don’t bounce and need a deeper correction before resuming the uptrend.
In the case of UNH stock, we’re there now. Shares are dipping to the 10-day and trying to find some support.
If it does, the stock could fill the gap at $486.50, then put $496 in play. Above $496 puts the obvious milestone in play — $500 — along with new all-time highs.
On the downside, a further breakdown puts the $465 breakout area in play, along with the 21-day moving average.
AbbVie (ABBV)
Click to Enlarge
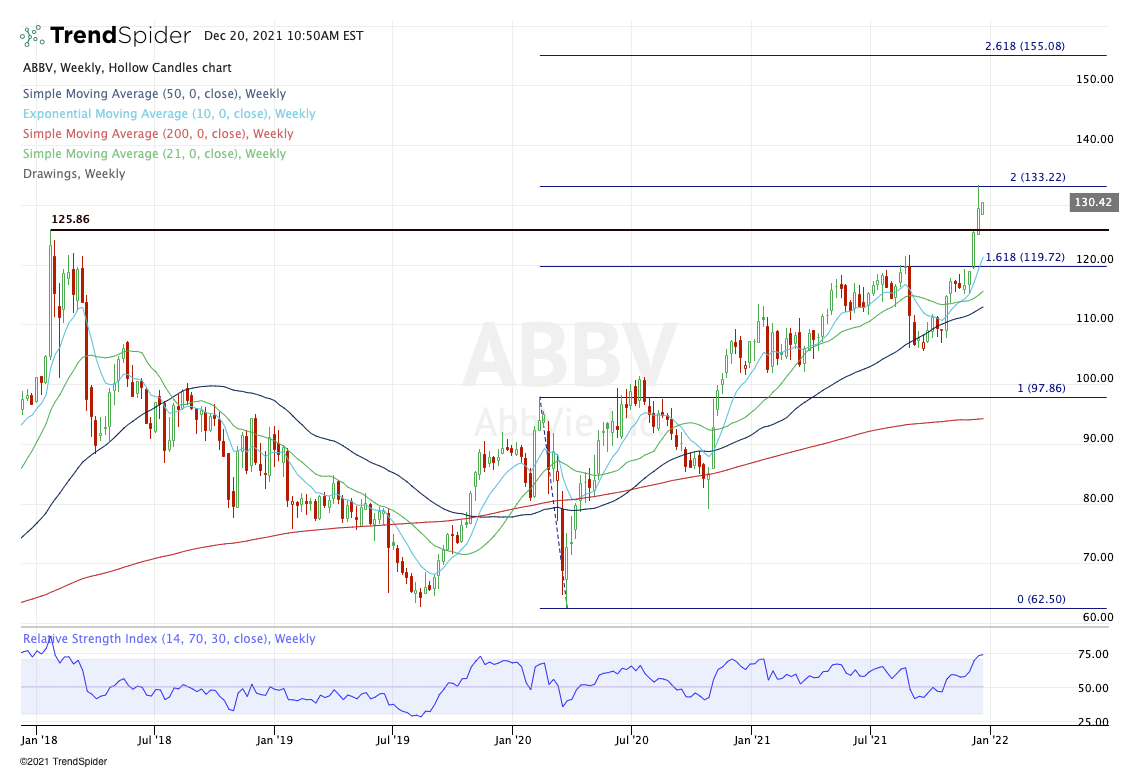
I really wanted to use a daily chart of AbbVie (here’s the daily), because the trend has been so incredibly strong. But there were too many levels to emphasize on the longer-term look.
That’s why I went with the weekly stock charts instead. In that view, you can see the range that we are drawing our upside extensions from, which is the March 2020 range. For many stocks, that is the widest pullback range to work with.
You may also notice that shares rallied right to the two-times range extension before pulling back.
Shares of AbbVie are currently up in 12 out of the last 13 daily sessions. Like P&G, UNH or some of our other strongly trending stocks, pullbacks to the short-term moving averages need to be respected.
In AbbVie’s case, feel free to look at it with a daily chart as we have with a few others. But for some of its longer-term trends, I want to look at the prior highs near $126 and the 10-week moving average.
A dip to these two areas may find support, allowing the trend to continue higher. It helps that the $121 to $122 breakout area is just below.
Working on its fifth straight weekly gain though and perhaps AbbVie needs a larger dip.
On the date of publication, Bret Kenwell held a long position in NVDA and UNH. The opinions expressed in this article are those of the writer, subject to the InvestorPlace.com Publishing Guidelines.
Bret Kenwell is the manager and author of Future Blue Chips and is on Twitter @BretKenwell.