Picking up where they left off last week, the bulls logged another gain on Monday. The S&P 500’s close of 2,832.94 yesterday was the best close since early October, though volume was suspiciously light.
 General Electric (NYSE:GE) led the way with a 2.4% gain, continuing a recovery driven by faith that a bigger-picture turnaround from the company is brewing. Bank of America (NYSE:BAC) wasn’t far behind with its 1.8% advance, however, pushing it well past a hump discussed in detail late last week.
Facebook (NASDAQ:FB) proved to be the biggest drag. Shares of the social networking giant fell 3.3% mostly thanks to a downgrade from Needham. Analyst Laura Martin is concerned that changes to the company’s business model could crimp earnings. Martin also noted the adverse impact of what’s quickly becoming a mass exodus of senior-level executives.
Headed into Tuesday’s trading action, however, it’s the stock charts of Invesco (NYSE:IVZ), Fidelity National Information Services (NYSE:FIS) and Gap (NYSE:
GPS) that are worth the closest looks. Here’s why, and what to look for.
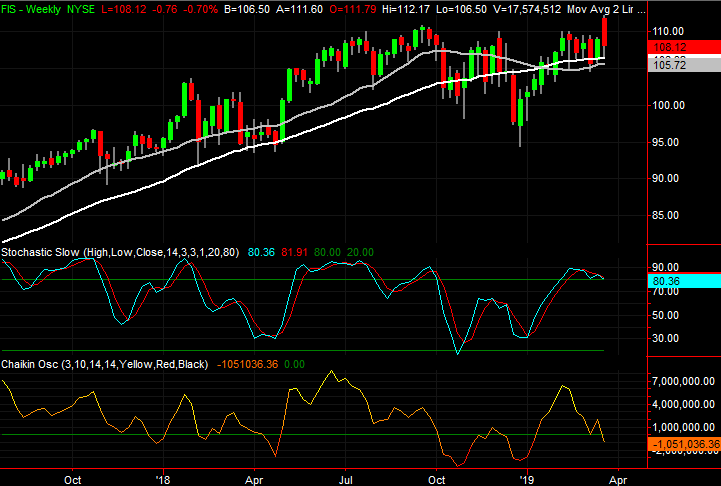
Fidelity National Information Services (FIS)
With nothing more than a quick glance it would be easy to jump to a bullish conclusion about Fidelity National Information Services, or as it’s more commonly called, FIS. The 50-day moving average line has crossed back above its 200-day moving average line as of the end of last week, and it hit a new multiyear high yesterday.
In many regards, though, the one thing more alarming than losing ground is a failed breakout thrust. That’s what we saw take shape with FIS stock on Monday, leaving traders with a tough choice to make, and soon.
Click to Enlarge
• Regardless of the underpinnings, if this is indeed a “sell the news” minded response, yesterday’s action serves as a potential pivot.
• That pivot will only be complete, however, if we see a close below the gray 100-day moving average line sometime this week.
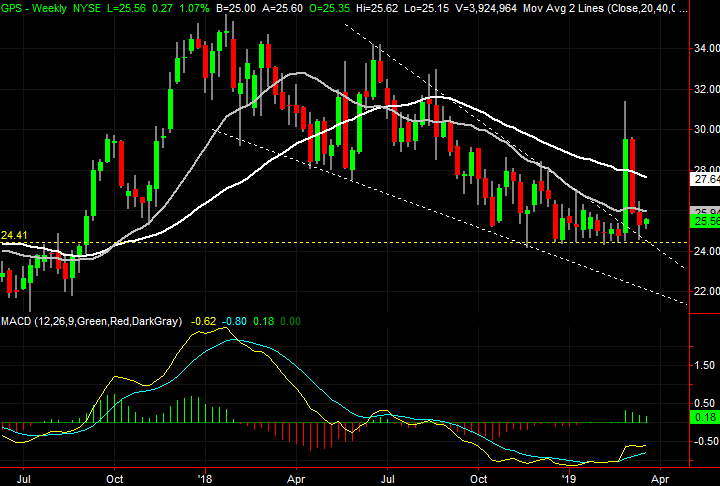
Gap (GPS)
In the same vein as the FIS chart, shares of Gap have just gone through a volatile shakeup that actually clears the deck for some more meaningful movement. But, GPS is much further along in the process, and ultimately positioned to move in a bullish rather than a bearish direction. And, like Fidelity National, there’s a little more work that needs to be done to seal the deal.
Click to Enlarge
• Friday’s bar is telling … the shape of it in particular. Though the stock closed at a loss for the day, it also closed well off the low for the day. The intraday reversal on high volume suggests the buyers were starting to wade back in.
• A close back above the 100-day moving average line, plotted in gray, would cement the second wave of the recovery effort in place.
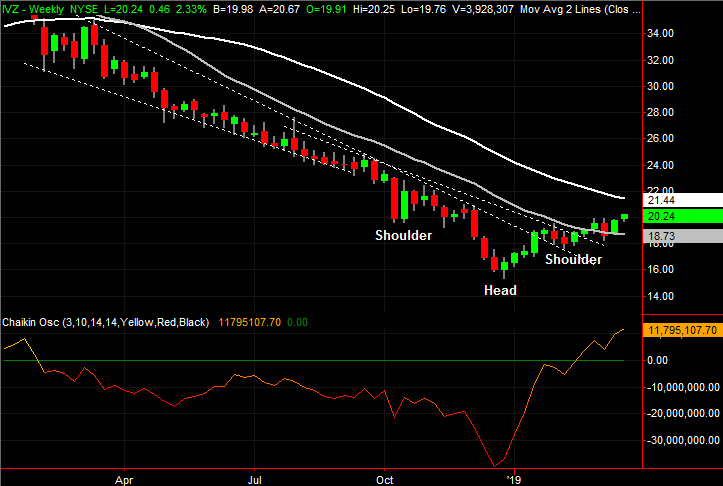
Invesco (IVZ)
Back on Feb. 26, Invesco was featured as a breakout candidate. Straight-line resistance had been snapped, and a key moving average line was on the verge of being hurdled. An upside-down head and shoulders pattern was even near completion.
All of that has played out as suggested, even if the rally took a breather a couple of weeks ago. The advance since then has confirmed and renewed that rebound work. But, for traders that didn’t step in then, there remains a great deal of room for more recovery.
Click to Enlarge
• The bears’ best shot at quelling the rally effort was preventing the move above last month’s high around $19.90, marked with a blue dashed line.
• Even with the recent strength, Invesco shares are still down roughly 40% from their early 2014 high, and below their white 200-day moving average line. That’s the next most plausible technical resistance.
As of this writing, James Brumley did not hold a position in any of the aforementioned securities. You can learn more about James at his site, jamesbrumley.com, or follow him on Twitter, at @jbrumley.