Tuesday’s pause turned out to be nothing more than that — a pause. The bulls grabbed the reins again on Wednesday, driving the S&P 500 to a record-high close of 2,914 on word that the U.S. was once again working with trade partners than working against them.
Amazon.com (NASDAQ:AMZN) did most of the heavy lifting, gaining 3.4% as it refuted claims made by Bernie Sanders that the e-commerce giant severely underpays its employees. The bulk of the day’s gain, however, stemmed from new bullishness from Morgan Stanley.
The brokerage firm’s research arm upped its price target on AMZN to $2,500, suggesting the company was in position to finally widen its perpetually thin profit margins.Though smaller in size and impact, Square (NYSE:SQ) shares also sizzled on Wednesday, rallying more than 6% after Guggenheim called it the “best idea” from the fintech arena.
Not every name was a winner yesterday though. Box (NYSE:BOX) fell nearly 11% on earnings guidance that left investors wanting more.
Headed into Thursday’s session, stock charts of Tiffany & Co. (NYSE:TIF), Celgene (NASDAQ:CELG) and
Oneok (NYSE:OKE) are the most promising trading prospects. Here’s a closer look.
Tiffany & Co. (TIF)

The one thing worse than a stock that’s losing ground is a stock that’s losing ground in the shadow of a failed breakout. Such a move only confirms would-be buyers’ worst suspicions.
That’s exactly why Tiffany & Co. may be on the verge of a meltdown. Shares were up as much as 7% on Tuesday in the wake of its Q2 report. But, they ended the day down for that day, and then lost another 4.4% on Wednesday. The move has left the stock on the verge of a major breakdown, and there’s plenty of room and reason for the stock to make that meltdown.

Click to Enlarge
• The 100-day moving average line (gray) at $123.37 might end up acting as a floor, reversing the downtrend. Only time will tell, though it won’t take much time.
• In the weekly timeframe we’ve already got plenty of bearish cues. Also on the weekly charts we can see the worst-case scenario downside target is around $95, which has been a floor and a ceiling since early last year.
Celgene (CELG)
Celgene shares went into full rally mode in July, but once they re-encountered the 200-day moving average line (white) earlier this month, things changed. It was no longer clear the bulls were interested. In fact, just a few days ago it appeared the 200-day line was going to become an outright ceiling.
This week, though, the bulls plowed in again, not only clearing the 200-day line, but breaking above a pretty important ceiling that’s plagued the stock since March when it was still in a downtrend.

Click to Enlarge
• Volume on both stock charts has been and continues to be bullish. The accumulation-distribution line has been rising for a while in both timeframes.
• Should this breakout take hold like it appears it is, the first checkpoint target is the December high of right around $111.
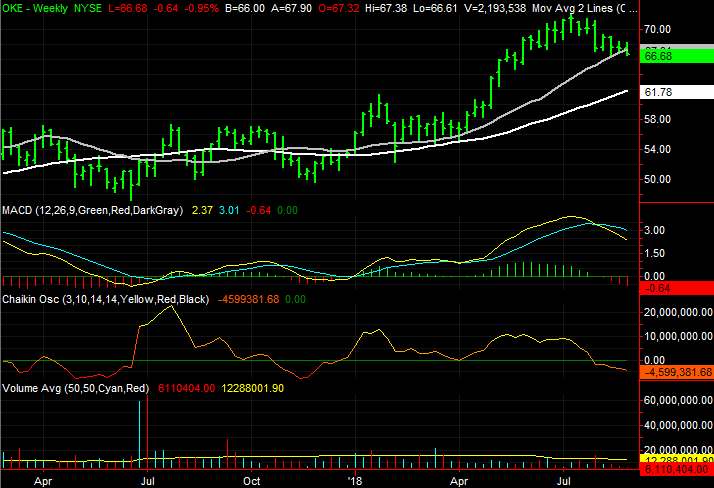
Oneok (OKE)
Last but not least, when Oneok took a hit back on Aug. 1 in response to last quarter’s revenue miss, it wasn’t clear that was the beginning of the end. The stock bounced slightly the following few days, and though that effort faded pretty quickly, there was still a glimmer of hope in the fact that the chart at least wasn’t taking on more water.
Thanks to Tuesday’s failed rally-renewal effort though, and Wednesday’s follow-through to the downside, OKE is toying with a break under a major technical support level. A move under that floor may finally convince the bulls they can’t afford to continue testing the waters of a rebound.
Click to Enlarge
• Underscoring the idea that OKE is hanging by a thread is the fact that the falling 20-day moving average line (blue) continues to act as resistance, guiding the stock downward. There’s no room left between the floor and the ceiling; something’s got to give, and soon.
• The weekly chart has already shown us a bearish MACD convergence and a Chaikin line that’s fallen below the zero level. It’s also clear on the weekly chart that the big rally in May and June has set the stage for a wave of profit-taking.
As of this writing, James Brumley did not hold a position in any of the aforementioned securities. You can follow him on Twitter, at @jbrumley.