It could have been worse, all things considered. A surprisingly high producer inflation report released early on Friday at one point had the S&P 500 in the hole to the tune of 1.6%. By the time the closing bell rang, the S&P 500 had cuts its daily loss to only 0.91%. And, it still logged another sizable weekly gain. The rebound is still in the hunt.
General Electric (NYSE:GE) arguably did most of the damage. Its 5.7% pullback was mostly the result of JP Morgan’s drastically lowered price target. Analyst Stephen Tusa has been suggesting GE was worth $10 per share, but lowered his target to $6 on concerns that the struggling company’s results could get worse before they finally got better. Yelp (NYSE:YELP) was the day’s most shocking loser though, falling 26.6% after posting lackluster third-quarter numbers and dishing out an equally lackluster outlook.
There were a handful of winners. Walt Disney (NYSE:DIS) advanced 1.6% following a healthy fiscal Q4 report, though traders may have been mostly been celebrating the progress its planned streaming product appears to be making. With falling stocks outpacing climbing stocks by nearly three to one, however, there just weren’t enough stories like Disney’s to lift the broad market out of the red.
As the new trading week kicks off, it’s the stock charts of Coca-Cola (NYSE:KO), Mondelez International (NASDAQ:MDLZ) and Ralph Lauren (NYSE:
RL) that may be holding the most potential for traders. In all three cases though, these names have at least one more thing to do before they’re over their respective humps.
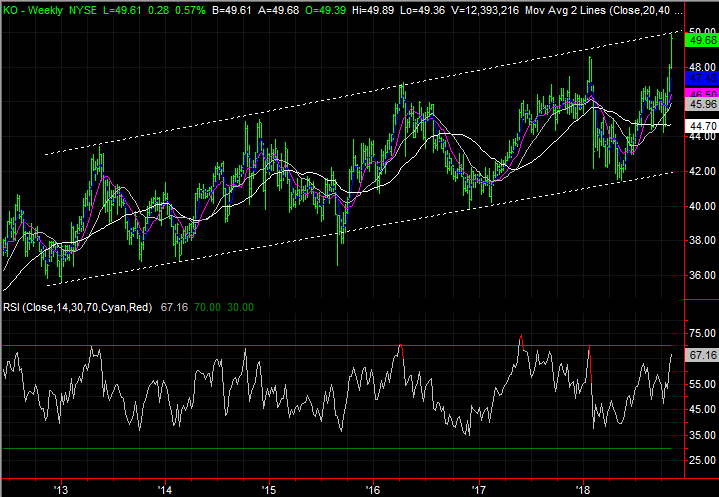
Coca-Cola (KO)

Exactly one week ago, Coca-Cola earned a spot on this list of noteworthy stock charts. It had broken past a major technical ceiling, and was in the midst of a very compelling bullish thrust. The stock’s performed will since then too, reward investors who may have pulled the trigger on a quick swing trade.
As of Friday’s gain, however, KO shares are back at another, bigger technical ceiling, and more than a handful of clues suggest the weight of the recent rally is going to start a wave of profit-taking.
Click to Enlarge
• Note also on the daily chart that the buying volume has been shrinking on the way up. This rally is running out of participants.
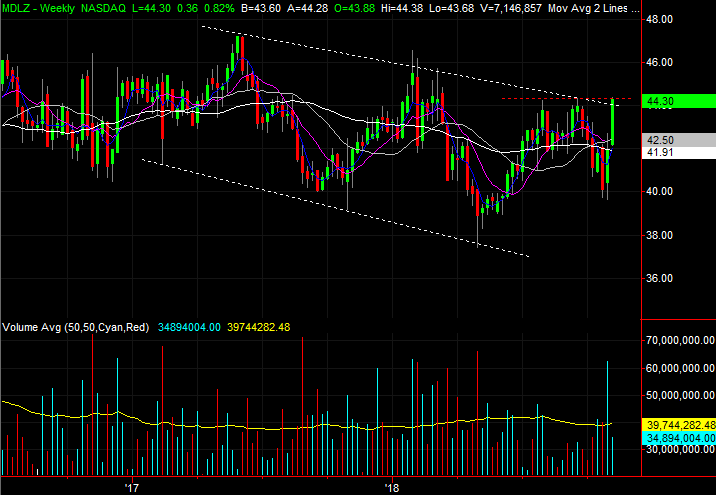
Mondelez International (MDLZ)
With just a quick glance Mondelez International shares look like they’re in the same boat as Coca-Cola. That is, it has been rising pretty quickly of late, but just bumped into a falling resistance line.
A closer, second look at MDLZ, though, reveals it has actually broken above a long-standing resistance level and is knocking on the door of pushing back another.
Click to Enlarge
• On the daily chart of Mondelez, the stock has already moved above a resistance line around $44.30, where the stock’s topped out a couple of times since August. On Friday, MDLZ briefly traded above that level despite marketwide weakness.
• Even if MDLZ doesn’t break through $44.30 right away, it’s still a make-or-break level that could signal a breakout move once cleared.
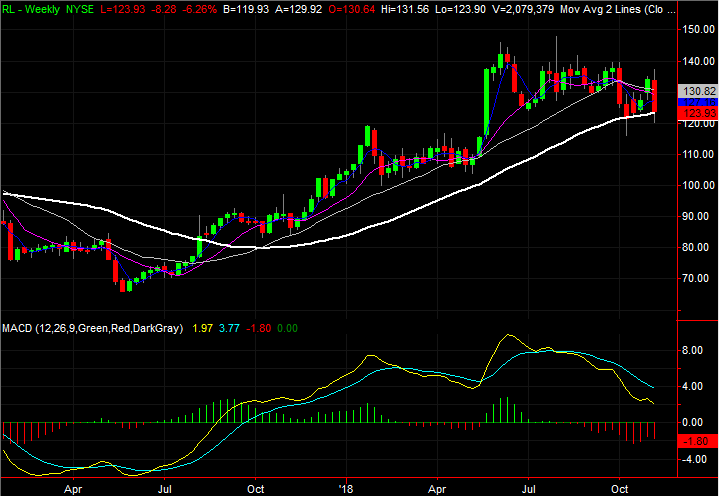
Ralph Lauren (RL)
Finally, sometimes the biggest bearish clues aren’t decisively bearish days. Rather, they’re the bullish efforts that ultimately fail, and turn into losses.
That’s where Ralph Lauren shares find themselves right now. The stock tried to break out a little over a week ago, and ultimately failed. And, the effort was rekindled late last week, and failed again. Now RL shares are one bad day away from a breakdown, and the bears have already proven the bulls don’t have staying power.
Click to Enlarge
• In October, it looked like the break below the white 200-day moving average line wasn’t going to be a problem. As of Friday, the stock is back to the brink of breaking below it. The bulls may not be so forgiving if it happens again.
• The selling volume has perked up as of last week, when the company’s earnings report forced traders to take sides. Most are choosing the bearish side.
As of this writing, James Brumley did not hold a position in any of the aforementioned securities. You can follow him on Twitter, at @jbrumley.