Stocks are taking a break despite gapping higher in morning trading on Thursday. Instead, the market is now pulling back slightly after a decent rebound for most of the week. Can we sustain the move higher or are we going back to the recent lows? Let’s look at some must-see stock charts for Friday.
Must-See Stock Charts for Tomorrow #1: General Electric
Click to Enlarge
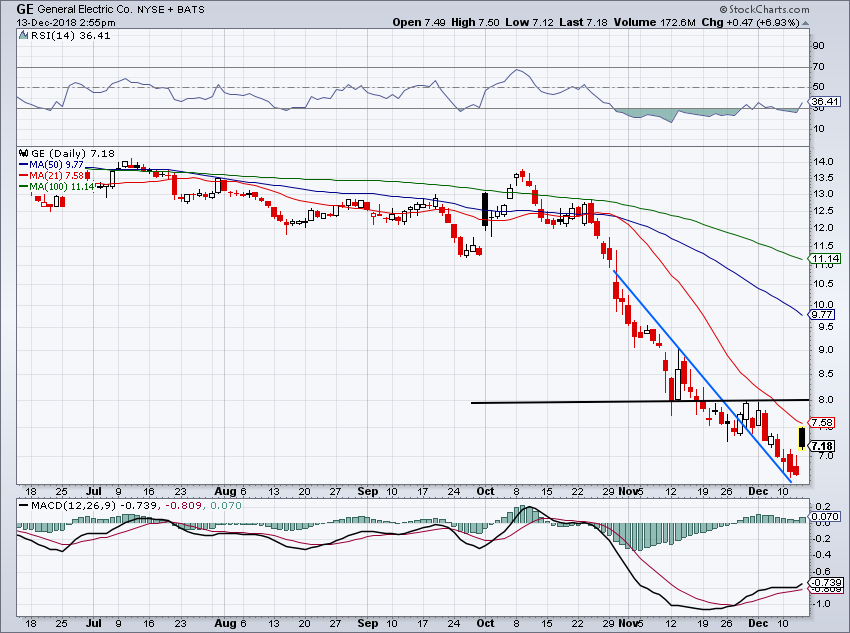
Shares of General Electric (NYSE:GE) are finally on the move, rallying 7% after JPMorgan analyst Stephen Tusa upgraded the stock from sell to hold. Tusa was the first analyst on Wall Street to issue a sell rating and to see him reverse his stance was once of three things we were looking for on when to buy GE.
So is it time to buy GE stock?
Maybe bears should at least consider covering their short, even though the fundamentals haven’t materially improved yet. After the rally, General Electric stock was promptly rejected from the 21-day moving average.
I’d like to see it hold up over $7, but at the very least, bulls have to see it stay above the recent $6.66 lows. If it can take out the 21-day moving average, look to see how GE does around $8.
Must-See Stock Charts for Tomorrow #2: Tesla
Click to Enlarge
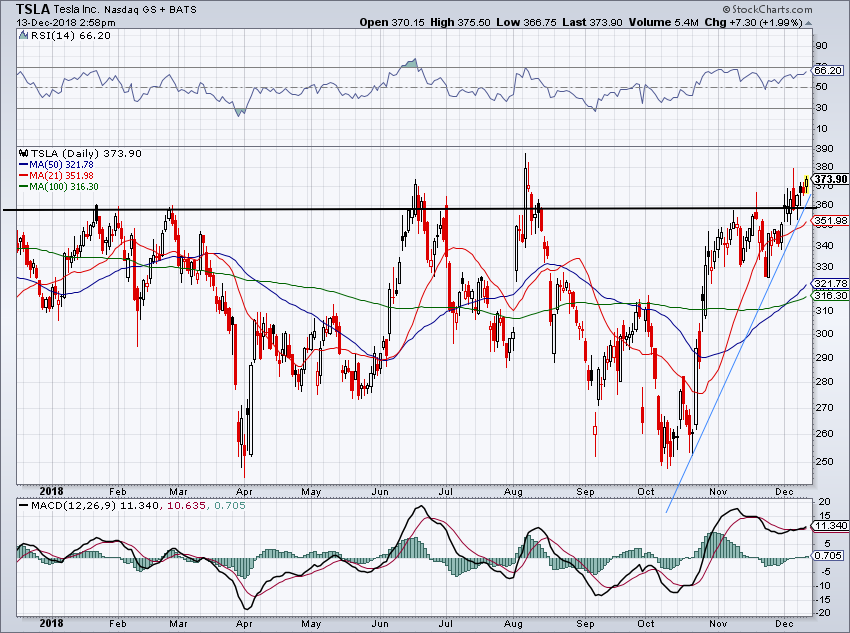
We have been pounding the table on how vital this $360 level is for Tesla (NASDAQ:TSLA) for quite some time. After pushing through it earlier this month, shares of Tesla continue to consolidate below it.
Based on production numbers and current plans for European expansion, I don’t think Tesla’s numbers are going to be bad this quarter. As this realization hits Wall Street, look to see shares squeeze higher.
The longer it stays above $360 and the higher it drifts, the more pressure bears will face to cover their position. A drop below $360 could unwind some of this action, but for now the risk is certainly to the upside. And don’t look for the broader market to push Tesla lower either. The stock has been one of the best performers through this corrective phase.
Below $360 and look for a test of the 21-day. Above, look for a drift higher to its prior highs near $390.
Must-See Stock Charts for Tomorrow #3: Adobe
Click to Enlarge
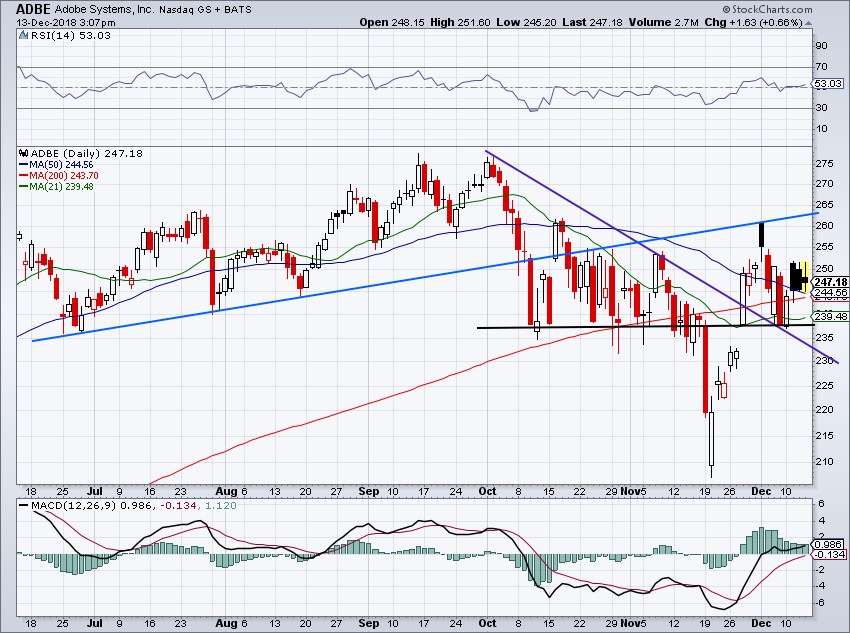
Adobe Systems (NASDAQ:ADBE) will report earnings after the close. What should investors expect?
Cloud companies have been reporting strong results this quarter, like Salesforce (NYSE:CRM), Splunk
(NASDAQ:SPLK) and others. Combined with Adobe’s positive analyst meeting back in October, I expect good results.
On a bullish reaction, look to see how Adobe does near $265, the backside of prior uptrend support (blue line). This level has held Adobe in check a few times over the last few months. On the downside, look to see how $240 holds up. Below and look to see if prior uptrend resistance (purple line) will support ADBE.
Must-See Stock Charts for Tomorrow #4: PayPal
Click to Enlarge
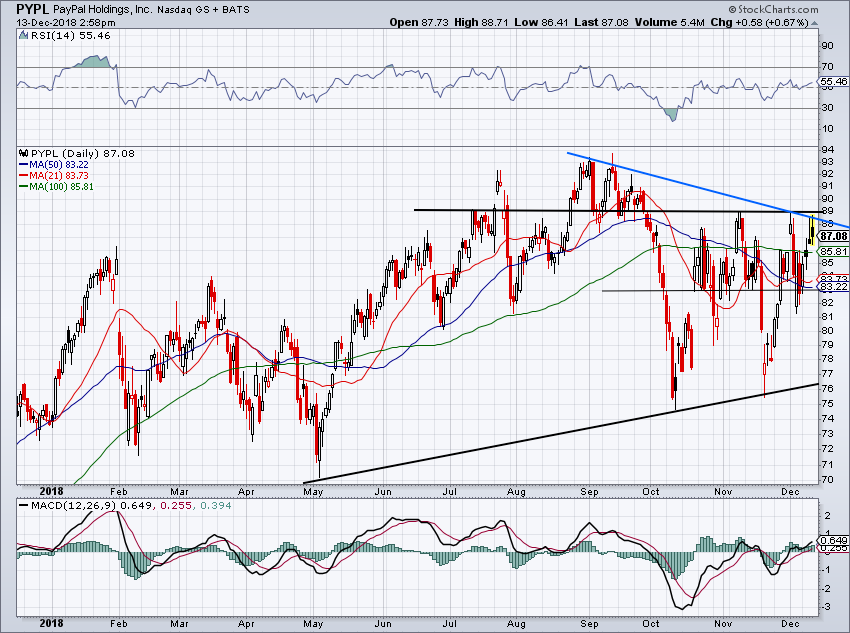
I want to believe that shares of PayPal (NASDAQ:PYPL) are primed to break out, given PayPal’s strong business and it having one of the market’s stronger balance sheets. However, PYPL stock is running into resistance near $88 to $89.
If investors have been long, taking some profit here isn’t the worst idea. Bears are surely looking at this low-risk shorting opportunity with a hope to squeeze PYPL back into the low-$80s.
On a close over this $89 level, shorts may want to cover and bulls may want to go long and look for a rally back to the $95-ish level. On a pullback, look to see how this $83 level holds up.
Must-See Stock Charts for Tomorrow #5: JD.com
Click to Enlarge
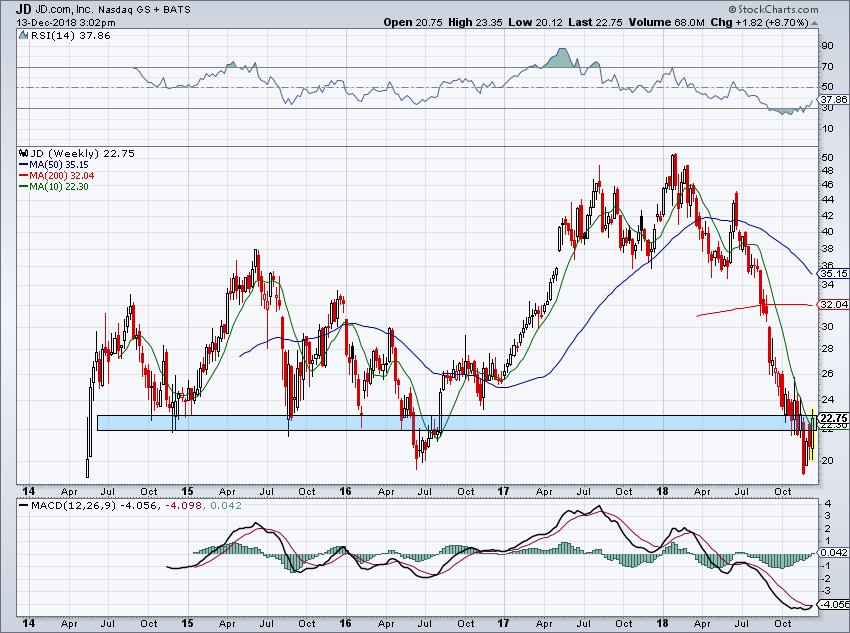
JD.com (NASDAQ:JD) is trying to bottom, but there are serious concerns on whether it can. U.S.-China relations are starting to thaw a bit, but can worsen at seemingly any moment. There are safer bets to place elsewhere in the market, but here are the levels for JD.com traders.
On the long-term weekly chart above, we need to see JD close over this $22 to $23 area. It’s currently over the 10-week moving average, which is encouraging, but I need to see that this prior support level won’t act as resistance.
Click to Enlarge
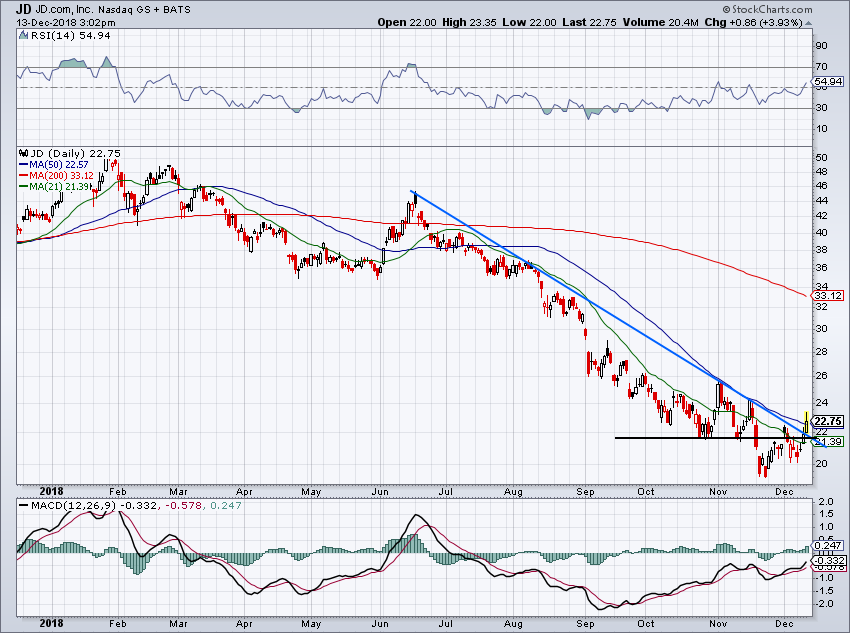
Looking at the short-term chart above, JD is technically over the 21-day and 50-day moving averages. It’s also over downtrend resistance (blue line).
If it drops back below these marks — so below ~$21.40 — then bulls should be concerned.
Bret Kenwell is the manager and author of Future Blue Chips and is on Twitter @BretKenwell. As of this writing, Bret Kenwell is long CRM.