A tepid start for stocks yesterday didn’t last. Hope for an end to the trade stalemate with China led the S&P 500 to a close of 2,635.96, up 0.76% on a move that dragged most indices above key technical resistance.
Bank of America (NYSE:BAC) led the charge again, gaining another 1.9% and setting a pace for most other banking and financial stocks. Advanced Micro Devices (NASDAQ:AMD) actually posted the bigger gain though, gaining 2.6%, yet also for no other reason than a potential end to the tariff-driven conflict.
A handful of stocks were left out of the rally, however. Morgan Stanley (NYSE:MS), for instance, fell 4.5% after posting surprisingly poor results for its recently-ended quarter.
As has been noted already, the divergence among stocks is actually beneficial, as it makes clear that not every stock is subject to the greater market tide. Stock-specific setups are at least a bit more trustworthy. To that end, take a look at the stock charts of Nike (NYSE:NKE), General Electric (NYSE:GE) and Wynn Resorts (NASDAQ:WYNN), all three of which are dropping hints of brewing, trade-worthy moves.
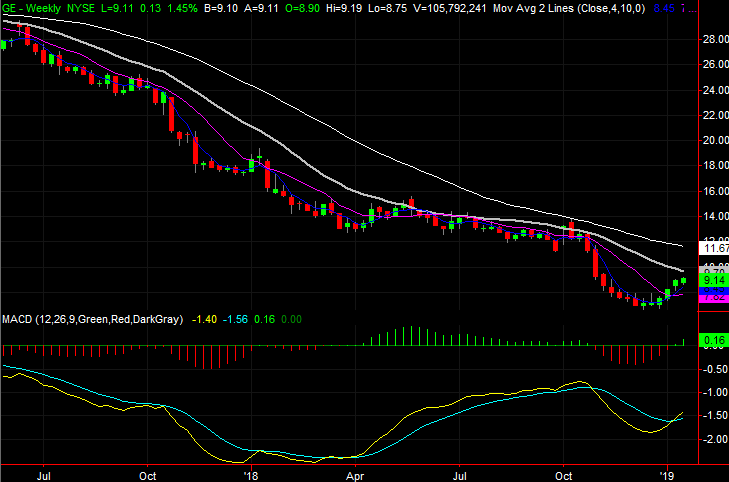
General Electric (GE)

Last week, General Electric was discussed as a budding rebound candidate that had bumped into a short-term ceiling. Though it was a hurdle that could have been challenging to clear, the undertow was encouraging.
That resistance remained intact for the next several days. As of Thursday, though, the bears flinched and the bulls tipped the scales just enough to merit another look.
Click to Enlarge
• The shape of the turnaround is also compelling. Smooth, u-shaped turnarounds tend to result in longer-lived rallies than sharp V-shaped ones do.
• Although the buyers are back in charge, there aren’t a whole lot of them. The buying volume needs to improve, though it likely will as (or if) GE works its way through the 100-day and 200-day moving average lines. It’s going to be more of a process than an event though.
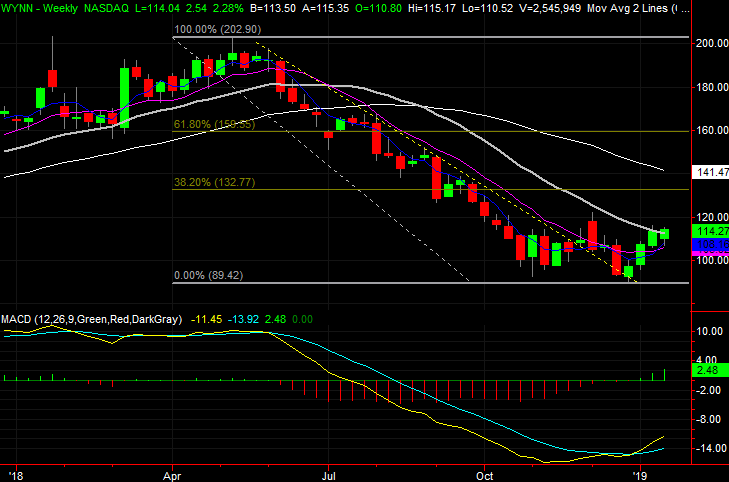
Wynn Resorts (WYNN)
With nothing more than a quick glance at the daily chart of Wynn Resorts it might look like the stock is merely chopping sideways after last year’s meltdown.
When taking a step back and looking at the bigger picture though — and examining the weekly chart up close — it becomes clear there’s more underway than just some sideways consolidation. The bulls are testing the waters for a reversal, having broken through some well-established resistance lines.
Click to Enlarge
• The next major ceiling is the gray 100-day moving average line, currently at $115.43. The buyers have demonstrated a bit of hesitation at it nears, but if it’s cleared, there’s little left to hold WYNN down.
• Beyond the 100-day moving average line, the next most plausible ceilings are the Fibonacci retracement lines at $132.80 and $160.40. The white 200-day moving average line around $145 is also a possible stopping point.
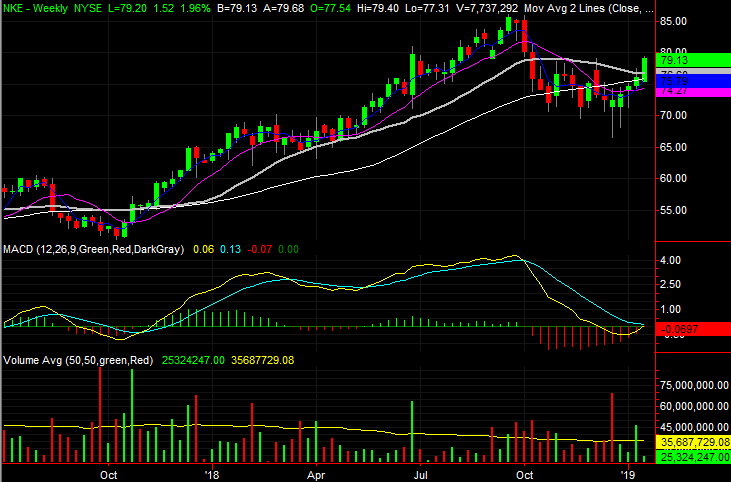
Nike (NKE)
A week ago, we pointed out how Nike shares had been habitually unable to hurdle a key moving average line. Though the third bump into this ceiling had not yet started another downtrend, until it was cleared, NKE was tough to justify buying.
It has been cleared since then. In fact, another major technical ceiling was cleared as of Thursday. It’s not a perfectly proven or clean break yet, but it’s close enough to refresh our look.
Click to Enlarge
• Perhaps just as important, Nike’s surge on Thursday has carried the stock above the recent technical ceiling around $78.80, plotted with a yellow dashed line.
• Though a solid thrust, the volume behind the effort has been thin. More buyers need to step up, but before they do they may want to see NKE slide back below $78.80, regroup, and march higher again.
As of this writing, James Brumley did not hold a position in any of the aforementioned securities. You can follow him on Twitter, at @jbrumley.