A little more hope for progress on the trade war front inspired another round of buying on Friday. Despite the three-day weekend ahead of them, the bulls were willing to plow in, driving the S&P 500 up 1.32% to the highest close in over a month.
Winners were plentiful, though the biggest and best gains came from companies that didn’t necessarily move the whole market. Overstock.com (NASDAQ:OSTK) was up more than 11%, mostly in response to news that its crypto-trading platform would launch next week. Square (NYSE:SQ) gained almost 5% after announcing on Thursday it would be offering debit cards to small businesses.
Friday’s marketwide gain too shape despite Tesla (NASDAQ:TSLA) acting as a drag. Shares of the electric vehicle manufacturer were off to the tune of 13% after the company announced it was laying people off, and after CEO Elon Musk cautioned that near-term profits wouldn’t be as robust as recently suggested.
None of those names are worth looking at today, due to their sheer volatility. Rather, stock charts of Intel (NASDAQ:INTC), eBay (NASDAQ:EBAY) and Fiserv (NASDAQ:FISV) merit closer looks because their tamer action has allowed trends to start taking shape.
Intel (INTC)

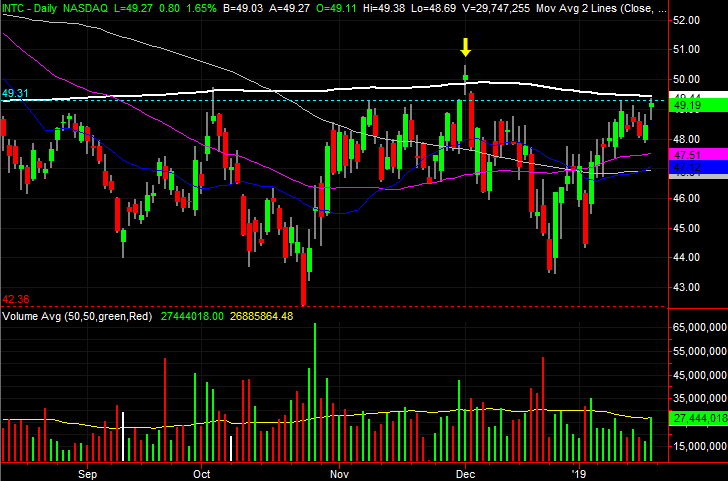
It was way back on Dec. 3 that Intel hinted at a break above a major horizontal ceiling. The move that day wasn’t meant to last, however. Too strong to sustain and with a gap left behind in the process, that day’s doji ended up being a pivot back into a downtrend. The doji in question is marked with a yellow arrow on the daily chart.
The line in the sand never stopped mattering, however … or lines in the sand, now. The recent bounce is once again testing that resistance, and while INTC shares aren’t back above either, they’re close to breaking back above both and kick-starting a sustained gain.
Click to Enlarge
• Also coming back into play now is the white 200-day moving average line, currently at $49.44. Traders are afraid to push their luck there now, and it only took a kiss of that line on October to send Intel into a dive.
• Friday’s high-volume move is telling. Most stocks only saw tepid pre-weekend buying interest on Friday.
eBay (EBAY)
Very early this year we noted eBay shares were coming out of a funk and looking to move into a new uptrend. The clues were only tentative at the time, but still worth watching.
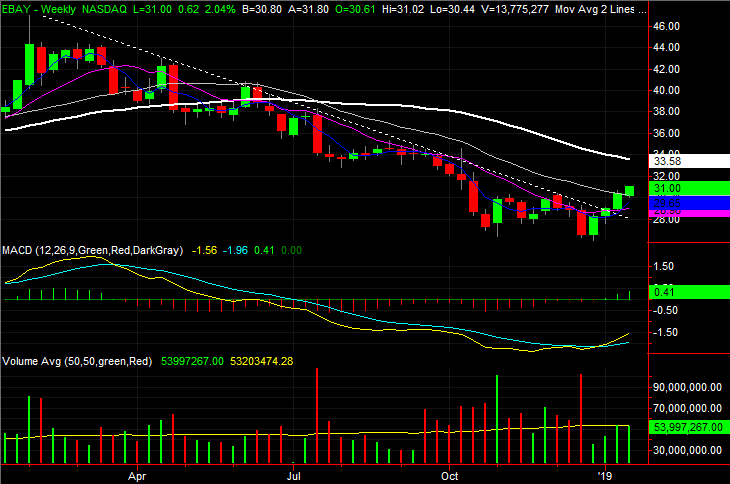
Much has changed in the meantime. Namely, the big technical ceiling that were still a factor then have since been left in the rearview mirror, and another resistance level that looked like it could have been a problem has also been hurdled. A good start to this week’s action could seal the deal on what could be a huge rebound effort.
Click to Enlarge
• This is all part of a much bigger breakout effort illustrated on the weekly chart. The line that had guided EBAY lower over the course of the latter half of 2018 stopped doing so three weeks ago.
• The bears are likely to push back from here. Keep in mind breakout thrusts are often born out of a process rather than a single-day event.
Fiserv (FISV)
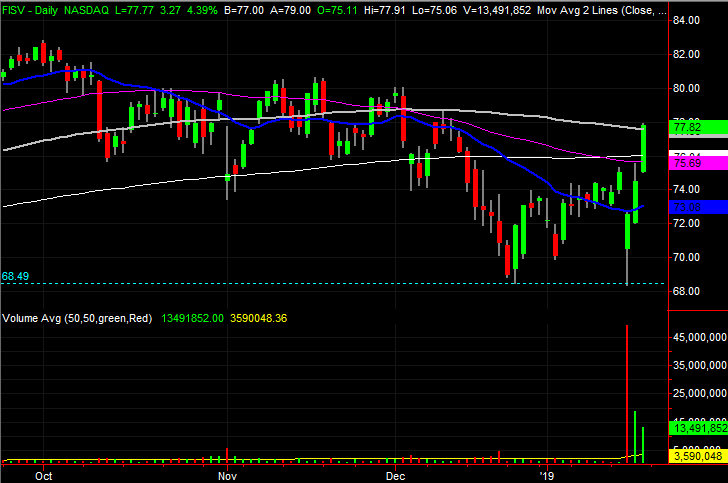
It was only last Thursday we suggested Fiserv was a buying opportunity, despite the previous day’s drastic loss on the heels of news that it was aiming to acquire First Data (NYSE:FDC). Too many hints suggested the sellers overshot their target, ceding all control back to the buyers.
Things panned out exactly as suspected. FISV followed through on Wednesday’s pivot on Thursday, and the buyers dug in again on Friday. But, that pendulum may have swung back as far as it was going to. From here, the buyers are apt to take at least a short break.
Click to Enlarge
• Underscoring the idea that Fiserv will need to pull back first before continuing to move higher again is the distinct lack of buying volume seen since then.
• The most plausible outcome from here is a dip back between the moving average lines around $78 and $73, a regrouping, and a renewed rally effort that takes shape at a more sustainable pace.
As of this writing, James Brumley did not hold a position in any of the aforementioned securities. You can follow him on Twitter, at @jbrumley.