Since Christmas Eve, FANG and the overall market have been on the rebound. Heck, Netflix (NASDAQ:NFLX) has rallied almost 40% off its Christmas Eve low. Facebook (NASDAQ:FB) had been one of the best FANG performers during December, a surprise to many investors given how poorly the name has done since July.
The sentiment is starting to charge, not only around Facebook stock, but around stocks in general. That has left investors wondering if now may be the time to get long the social media giant.
After all, Facebook possesses platforms like Instagram and WhatsApp, not to mention its own legacy platform. Thanks to its rich vault of user data, it’s able to offer advertisers pinpoint accuracy when it comes to targeted ad searches. For years, that paved the way to enormous growth at Facebook, not to mention its huge margins.
The company has been under attack this year though. The media has been slugging Facebook left and right for its questionable data use and business practices, while management hasn’t exactly been upbeat. That has put a beating on the stock, as you’ll see in the two charts below.
Trading FB Stock
Click to Enlarge
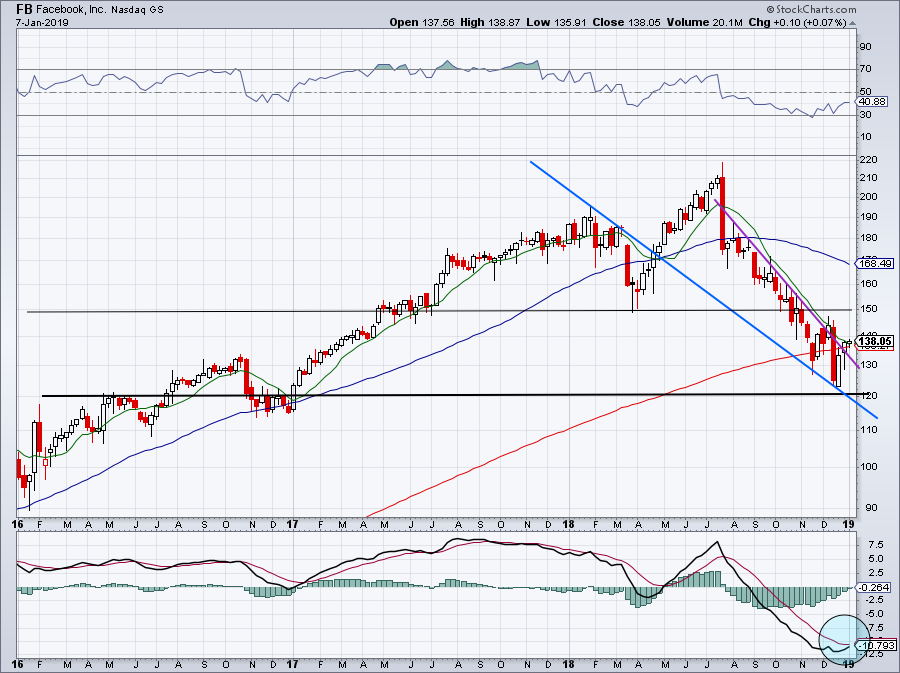
A look at the 30-month weekly chart shows how quickly Facebook stock price has retreated. Shares sank from almost $220 at its highs in July to sub-$125 last month. From peak to trough, we’re talking about a roughly 45% decline.
That’s a big-time beating for what was one of the market’s best-performing stocks over the last few years. After falling below the 200-week moving average in December, FB stock has regained this level. In fact, it’s pushing over downtrend resistance (purple line) as well as the 10-week moving average. That’s an encouraging sign for bulls and if the market can maintain momentum, FB stock could be ready to make a large move, perhaps back to the $150-ish level.
We can also see that momentum is slowly progressing to a potentially bullish setup, highlighted by the blue circle at the bottom. Should resistance succeed and knock FB back down, I want to see if $130 holds as support. If it doesn’t, $120 could be on the table.

Click to Enlarge
On the short-term chart above, we see Facebook stock poking over the 21-day moving average. However, it’s near downtrend resistance (blue line) and just below the 50-day moving average. Over the 50-day and FB stock will look much better and it could pave the way to a rally up to the $150 to $155 area.
Ultimately, I need to see what levels hold up as support for FB, rather than what levels hold up as resistance. Resistance gives bears a low-risk shorting opportunity, but those looking to buy need to know what level is safe. Right now, that’s not entirely clear. I would love to see FB hold this $130 to $132 area on a market-wide pullback
.
Bottom Line on Facebook Stock
Facebook has a lot of positives, despite floating in a sea of negatives at the moment. It owns some of the internet’s most prized possessions and makes plenty of money in the process. However, the company has very much become a prove-it story.
The prove-it thesis holds solid ground on the technicals, as you can see above. Facebook stock literally has to prove to investors that it has what it takes to rally, and that means it has to get out of this nasty downtrend. On the fundamental front, management needs to prove it can achieve growth.
While 2018 will probably still be a solid year for Facebook fundamentally, 2019 is not the same. Facebook is forecast to grow sales and earnings about 36% this year. In 2019, earnings expectations slow to just 0.9% growth, despite almost 25% revenue growth. That leaves FB stock at about 18.4 times this year’s earnings.
Not an outrageous valuation, but without a return to earnings growth, investors won’t want to pay up to own this name. Even if it’s more profitable than social media peers like Snap (NYSE:SNAP) and Twitter (NYSE:TWTR).
Bret Kenwell is the manager and author of Future Blue Chips and is on Twitter @BretKenwell. As of this writing, Bret Kenwell did not hold a position in any of the aforementioned securities.