The market has been playing with fire for the better part of the week, and finally got burned on Thursday. Yesterday’s 0.81% tumble left the S&P 500 just a tad below its 200-day moving average line, with a not-entirely-small army of would-be sellers ready to drive it lower in the event the picture doesn’t improve soon.
 Kroger (NYSE:KR) did more than its fair share of the damage. Shares of the grocery chain fell nearly 10% following a fourth-quarter earnings print that came up short of expectations. CVS Health (NYSE:CVS) chipped in quite a bit too though, off more than 3% as the long-standing selloff has now reached a self-sustaining pace.
There are a few winners. Ever-unpredictable General Electric (NYSE:GE), for instance, bounced more than 3% after steep selling earlier this week dragged shares back to a key technical support area. There just weren’t enough GE’s.
None of those names are of particular interest as we get the last day of the trading week started though. Rather, it’s the stock charts of Oracle (NYSE:ORCL), Dollar Tree (NASDAQ:DLTR) and Tyson Foods (NYSE:TSN) that merit the closest technical looks.
Oracle (ORCL)
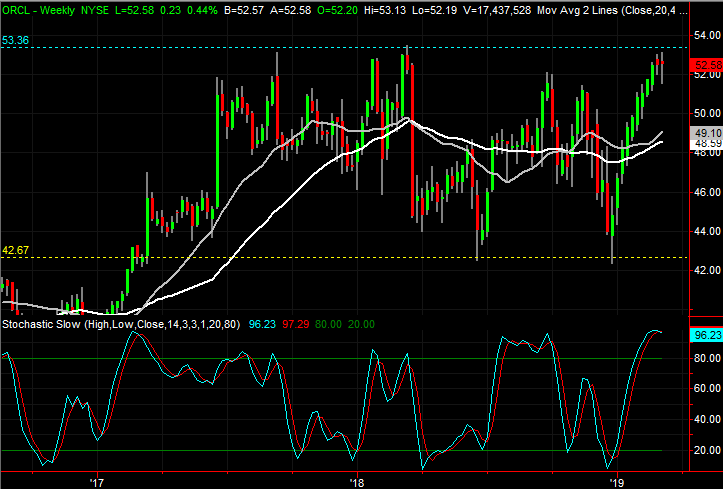
Three weeks ago, Oracle looked unstoppable. The stock bounced as hard as any other after the December meltdown, and appeared to have enough momentum to blast past a huge technical ceiling,
Now, not so much. The rally effort has stalled exactly where one would have expected it to, and the shape of this week’s bars says the stock is one stumble away from slipping back into a pullback.
Click to Enlarge
• Note the shape of the bars on the daily chart. In most recent cases — and particularly on Thursday — Oracle’s closing prices have been well off the highs for the day, suggesting traders are even more leery of sticking with ORCL than it seems on the surface.
• Though a move back to the $43 area, where the stock found a floor twice last year, is unthinkable right now, it was unthinkable those two times as well.
Tyson Foods (TSN)
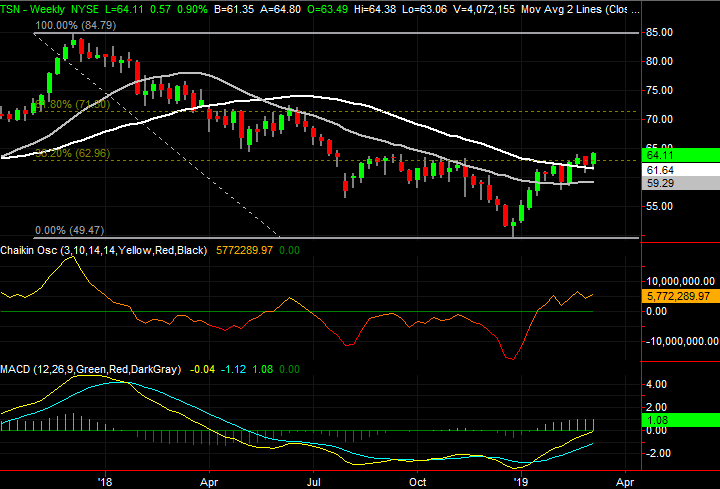
The last time we looked at Tyson Foods back on Feb. 25, it had just crossed above its 200-day moving average line, and was toying with a break above a pretty important resistance line that went all the way back to September.
The effort petered out, but thanks to this week’s strength, the budding breakout move is healthier than ever. One more good day could easily get TSN shares over the hump, overcoming what looks to be brewing bearishness from most other stocks.
Click to Enlarge
• This week’s bullishness has also gotten TSN over another critical hump though. Zooming out to the weekly chart, we can see Tyson shares have fought their way back above the first key Fibonacci retracement line based on the late 2017 highs and late last year’s low.
• Unlike most other stocks right now — even the ones that are making ground — the bullish volume behind this advance is growing, pulling the weekly chart’s Chaikin line above the zero level.
Dollar Tree (DLTR)
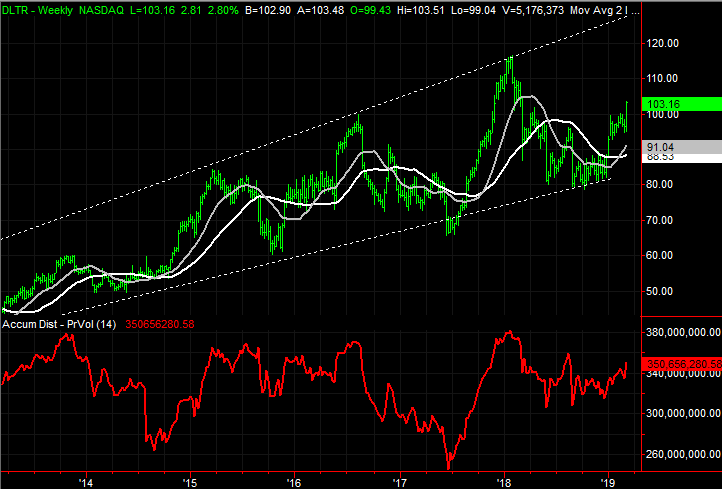
Finally, with nothing more than a quick glance, this week’s big bullishness from Dollar Tree not only seemed unlikely, it seems unlikely to last. The rally started out in an overbought condition thanks to the January jump, and has only added to that condition now.
There’s more to the move than readily meets the eye though, and while we might see a little bit of a profit-taking pushback, such a dip might be a great entry opportunity.
Click to Enlarge
• It’s the weekly chart of DLTR that really paints a bullish picture though. As was described back in late December, Dollar Tree shares have been guided higher by rising trend, the lower of which ultimately sparked the current uptrend.
• Though it will take some time to get there, assuming the pattern on the weekly chart repeats itself, DLTR is en route to the upper boundary, currently near $130.
As of this writing, James Brumley did not hold a position in any of the aforementioned securities. You can learn more about James at his site, jamesbrumley.com, or follow him on Twitter, at @jbrumley.