Although the market spent most of yesterday in the red, when push came to shove as the closing bell approached though, the bulls ended up winning. It was a low-volume, lethargic effort, but the S&P 500 managed to end the day up 0.1%.
 Snap (NYSE:SNAP) set the pace, and the tone, gaining 3.6% as investors continue to celebrate the prospects and potential of adding mobile gaming to its app. New Age Beverages (NASDAQ:NBEV) was the headliner on Monday though, up more than 38% on the heels of news that some of its “Marley” beverages would be sold at Walmart (NYSE:WMT).
At the other side of the spectrum, General Electric (NYSE:GE) fell more than 5% after J.P. Morgan analyst Stephen Tusa reminded investors exactly why he’s still bearish on the industrial giant’s rebound effort. He downgraded GE stock to “Underweight,” and simultaneously lowered his price target to $5.00.
Headed into Tuesday’s trading, however, it’s stock charts of Cabot Oil & Gas (NYSE:COG), Principal Financial Group (NASDAQ:PFG) and
Westrock (NYSE:WRK) that are worth the closest looks. Here’s why, and what to look for.
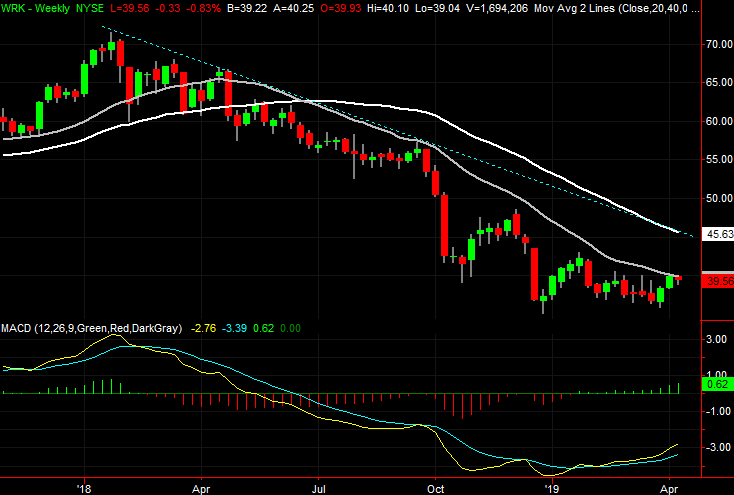
Westrock (WRK)
With nothing more than a quick glance, Westrock looks like it’s still stuck in a downtrend, and just chopping around. And, maybe it is.
But it’s teetering close enough to a major breakout move that a closer look is merited. A little more bullishness could carry WRK over a key hump and unleash months’ worth of pent-up buying.
Click to Enlarge
• The other technical resistance coming into play again is the gray 100-day moving average line, currently at $40.53. The last time this line was brushed in September it ended serving as the start of a major tumble.
• If the potential breakout takes hold, the most likely “next” target would be around $45.60, where the white 200-day moving average line is, and the line that’s touched all the key peaks since early 2018 currently lies. That ceiling should be adjusted lower as needed.
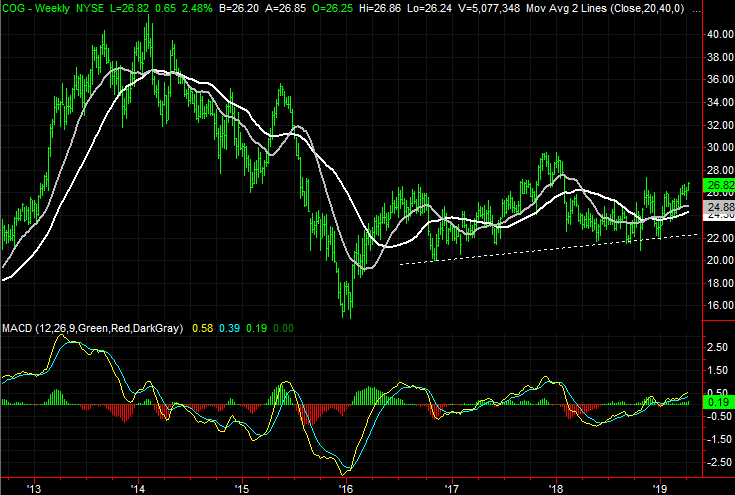
Cabot Oil & Gas (COG)
Back on Feb. 22, Cabot Oil & Gas was featured as a turnaround candidate. It struggled for the first half of last year, but over the course of the latter half of 2018 and early 2019, the bulls chipped away at a turnaround.
That didn’t happen. In fact, the sellers took charge that very day. The pullback, however, was stopped and reversed exactly where it needed to, and the stock eventually worked its way back above a key technical ceiling. Thanks to yesterday’s action, the budding uptrend is even better solidified, finding support once again at a key technical support level to log the best daily close in over a year.
Click to Enlarge
• Zooming out to the daily chart puts things in perspective. This is the beginning of the second push out of a U-shaped reversal effort. This one may unwind the 2014-2015 selloff that 2017’s effort couldn’t.
• While Monday’s volume was better than the volume seen in the past few weeks, it’s still below average and not necessarily enough of a majority opinion to really provide a rock-solid undertow.
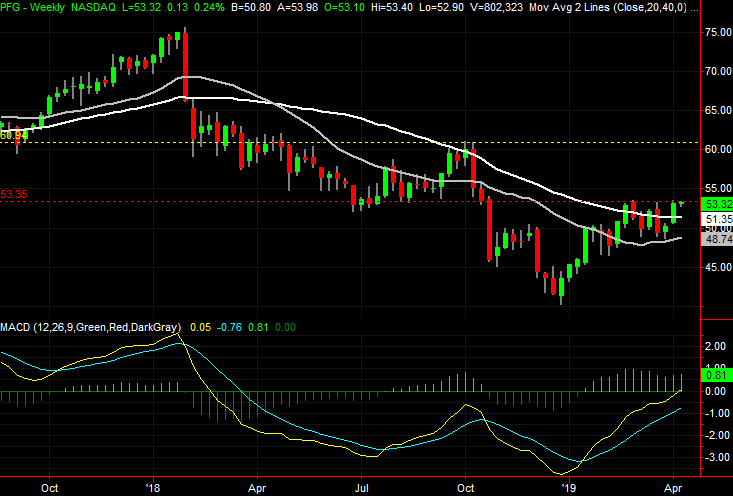
Principal Financial Group (PFG)
Last year was a particularly tough one for Principal Financial Group, with PFG stock falling from a peak near $76 to December’s low around $41. Shares have snapped back in the meantime, but that has not been terribly impressive, as most stocks have been rallying since January.
The rebound effort unfurling here is about to get a whole lot more interesting, however, in a good way. Shares are knocking on the door of a well-defined technical ceiling that, if hurdled, could spur a major wave of buying that cuts into much more of last year’s losses.
Click to Enlarge
• Although it wouldn’t materialize for a few more days, and until after a break above $53.50, we’re nearing a so-called golden cross where the purple 50-day moving average line moves above the white 200-day line.
• If Principal shares do break out, the next checkpoint target is around $61, plotted in yellow on the weekly chart. That’s where shares hint a key ceiling in September of last year.
As of this writing, James Brumley did not hold a position in any of the aforementioned securities. You can learn more about James at his site, jamesbrumley.com, or follow him on Twitter, at @jbrumley.