The last time I reviewed the Sector SPDR ETFs, I said that the rally was coming to an end and it certainly looks like it could be. Why did I make this prediction? I’m not psychic, it wasn’t a guess, and I really couldn’t care less about the Federal Reserve or trade wars. I thought that the rally was ending because various sector SPDR ETFs were running into resistance and the consumer discretionary sector was due for a pullback because Amazon (NASDAQ:AMZN) was overbought.
 As someone who traded at various hedge funds over the past 20 years, I can tell you with 100% certainty that the vast majority of moves made by the S&P 500 Index SPDR (NYSE:SPY) have nothing to due with what the so-called experts in the financial media are attributing to.
In financial markets, there are certain price levels that are more important than others with regards to the amount of supply and demand that exists at them. In addition, prices are always doing one of 3 things. Going up, going down, or staying the same.
Most moves in the SPYs are caused by the reaction the underlying sectors that make up the S&P 500 make when they get to these levels or the trend changes. For example, if a sector gets to important support while being oversold, it tends to rebound. If it is not oversold, it tends to consolidate and break the level. It has nothing to do with what Jim Cramer is screaming about or what the analysts are saying.
If you want to get insight into the S&P 500 or SPY, you should look at how the various acting. For example, technology led most of the recent rally — until the end when the consumer discretionary became more important. Different things drive and influence the market at different times.
Let’s look at some of the sectors to gain some insight into the future direction of the SPY.
Financial Sector SPDR (XLF)
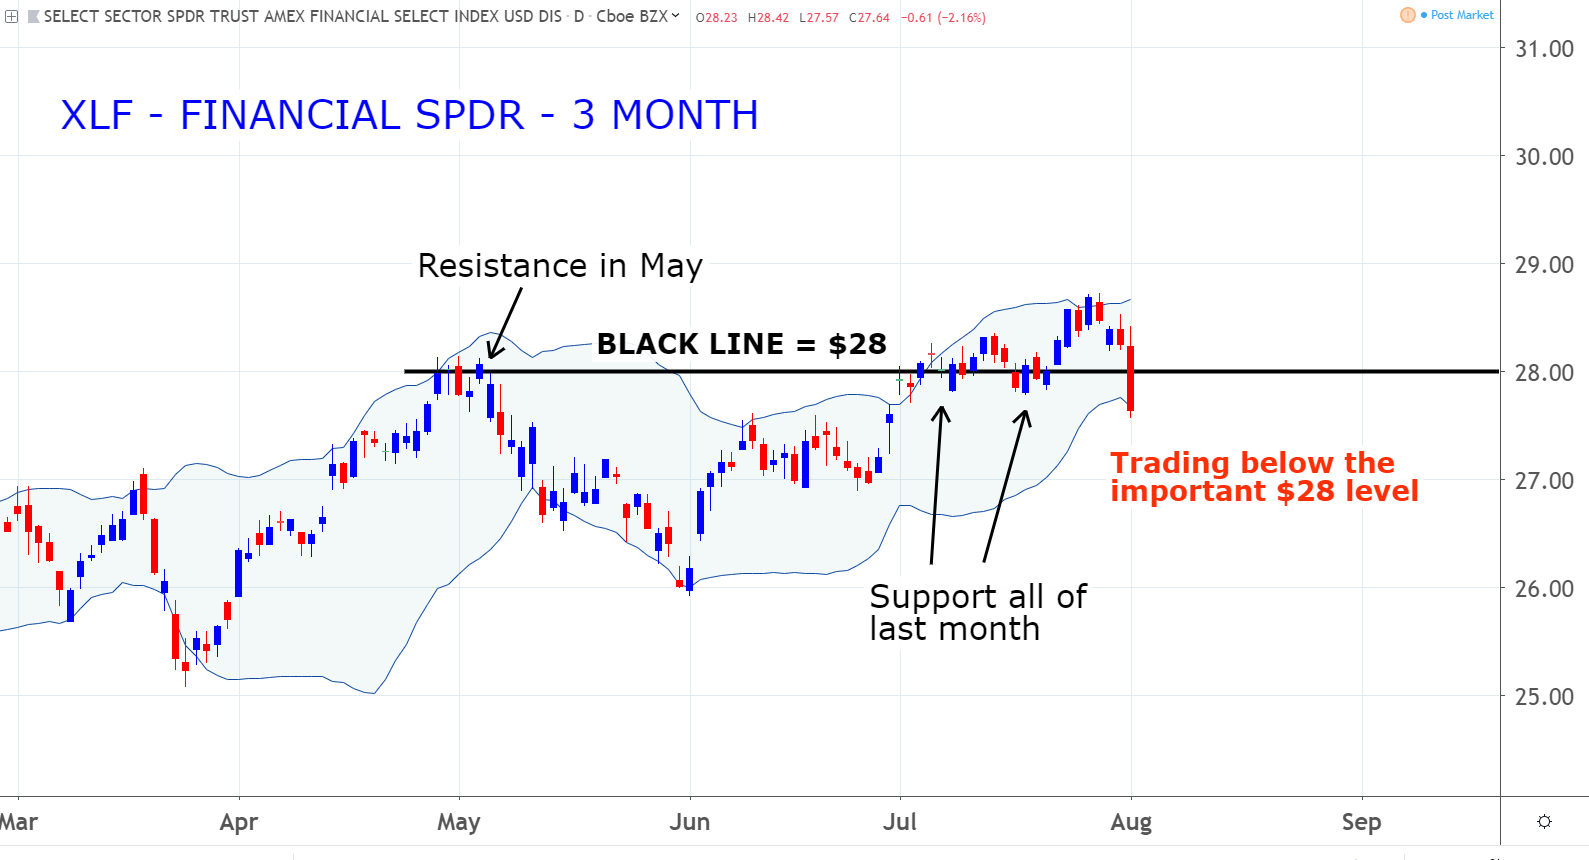
The Financial Sector SPDR (NYSEARCA:XLF) has broken support at the important $28 level. This level is important because it was support through all of July, after being a resistance level in May.
This will probably be the most important sector to watch over the next week or so. If the XLF fail to rebound back above this level it will be a signal that the SPY are going to trend lower.
If the XLF continue to head lower, there may be some support around the $26 level. This is because this is where the lows were at the very end of May.
Consumer Discretionary Sector SPDR (XLY)
The Consumer Discretionary Sector SPDR (NYSEARCA:XLY) has also broken important support. The $121 level was resistance in April and June.
One of the things that led the recent rally was the buying of AMZN stock. Amazon is about 20% of this sector, and as I mentioned last time, AMZN stock was the most overbought that it had been in two years. This brought sellers into the market and this made the stock, and the XLYs, go lower.
The dynamic here is similar to that of the XLF. If the XLY does not quickly rebound back over the $121 level, it will be another signal that the SPY is going to trend lower.
Technology Sector SPDRs (XLK)
The
Technology Sector SPDR (NYSEARCA:XLK) has also broken its uptrend. If it continues to sell off, there will probably be some short-term support around $79. This is because this level was resistance in April and June. If it breaks, the broader markets will drop because the tech sector is the biggest part of the S&P 500.
How does a resistance level become a support level? The investors who sold their stock at $79 thought they made the correct decision to sell when it traded lower. The short-sellers were looking at a profit.
Then when it rallied through the $79 level, the sellers think they have made a mistake and decide to buy XLK if it gets back to $79. The short-sellers tell themselves that if they can cover and break even, they will. Those who bought it at $79 believe they made a good decision and tell themselves that they will add to their positions at $79 if they can.
Added to this are the professional traders seeking to profit off of a clear level you can see that there are four groups who want to buy XLK at $79. This demand creates a support level.
Healthcare Sector SPDR (XLV)

The Healthcare Sector SPDR (NYSEARCA:XLV) has been trending lower over the past month. There will probably be some support around the $90 level because it was resistance in May.
If the XLV finds support around $90 and breaks the downtrend, it could stabilize the SPY. The reaction that the XLV makes if and when it gets to $90 will be important to consider.
Energy Sector SPDRs (XLE)
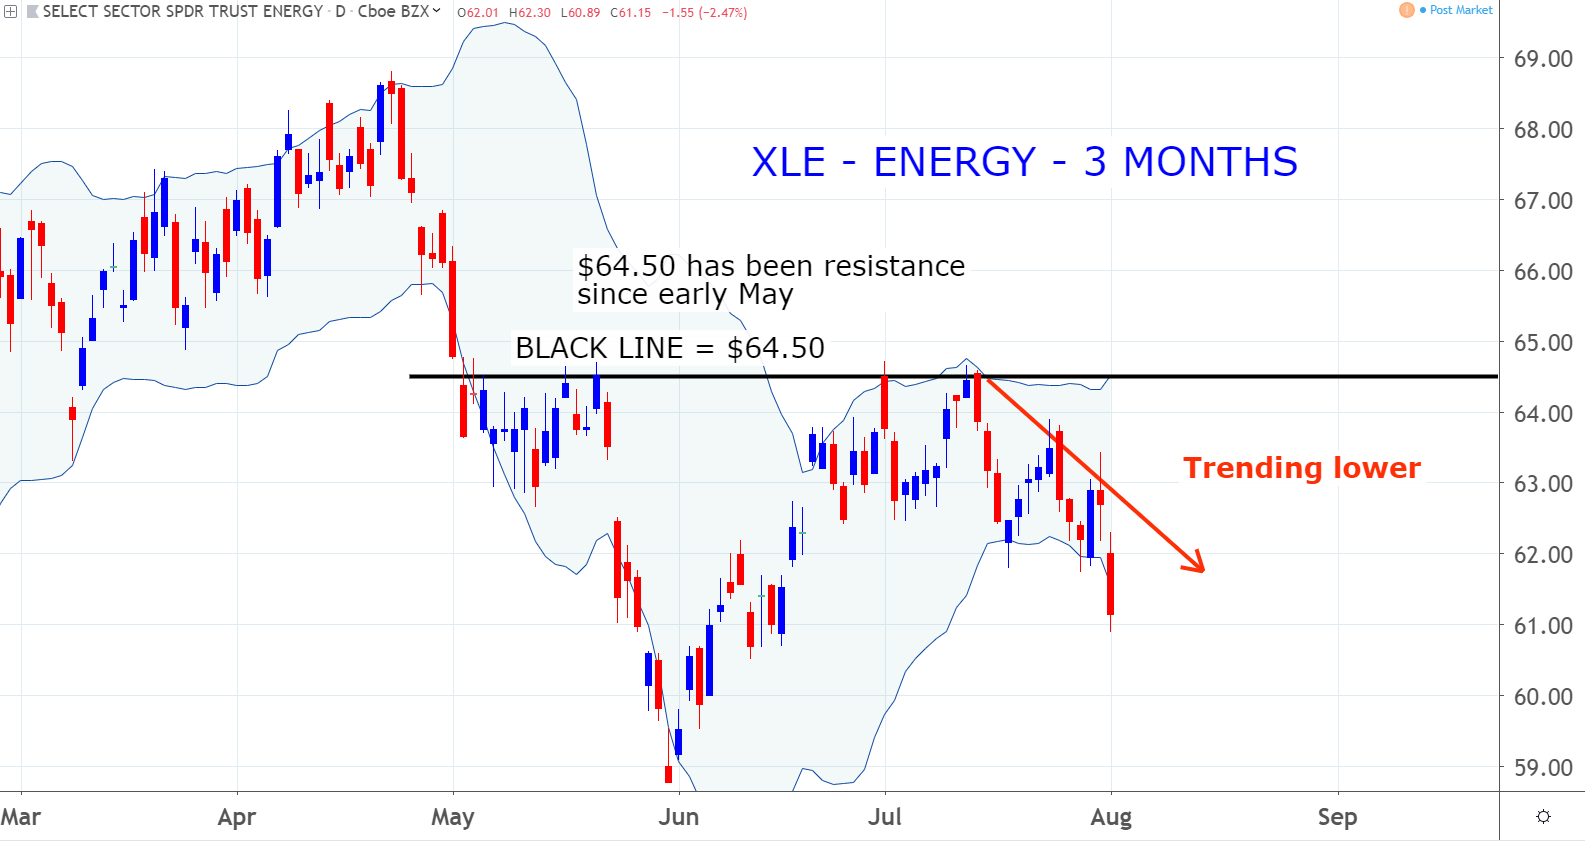
The Energy Sector SPDR (NYSEARCA:XLE) continues to trend lower.
The XLE started its downtrend last month when it failed at resistance around the $64.50 level. This level was resistance in May, and then again in July.
A break of the downtrend line here could be a signal that the selloff that has occurred in the SPY may be coming to an end.
Industrial Sector SPDR (XLI)
The Industrial Sector SPDR (NYSEARCA:XLI) failed at the resistance at the $78.50 level.
You don’t need to be a market guru or a master trader to see that this level is important. It was resistance at the end of April and in early May. The XLI has also broken its recent uptrend that began in June. Obviously drawing trendlines is an art and not a science, but if you understand what they illustrate you can profit.
When markets are going up, the forces of demand are in control, and when they are trending lower the forces of supply are in control. If they are consolidating or trading sideways, the forces are equal. The breaking of a trendline means that the leadership may be about to change or equalize. The break of the uptrend line here could be an early indication a downtrend is beginning.
S&P 500 SPDR (SPY)
The S&P 500 SPDR ETF is testing important support. These are some dynamics to consider to gain insight into whether or not this important level will break or hold. Probably the most important thing to watch is how the XLF reacts to the $28 level. If they do not rebound over the next few days, it will be very bearish for the SPY.
It is also important thing is how the XLY reacts to the $121 level. If it does not rebound over the next few days and this level becomes resistance, this could also be very bearish for the SPY.
The way the XLK reacts to the $79 support level is important as well. If this level breaks, watch out below.
I will also be watching to see if the trends in the XLV and XLE continue. A break of these downtrend lines would be bullish for the SPYs.
Most of the dynamics that I see are bearish and I do expect the market to start trending lower. Every time the market sells off after a rally, it seems like people forget that markets go down as well as up.
Considering the gains that the market has made since early June some profit taking would not be surprising.
As of this writing, Mark Putrino did not hold a position in any of the aforementioned securities.