Investors in exchange-traded funds remain on edge as the major indices began the New Year like that friend who doesn’t know when to stop drinking.

Some may see the volatility as a buying opportunity, while others are likely heading for shelter in cash or other safe haven assets.
No matter your short-term outlook, the price action in the leading sectors can enhance your perspective on the market.
The perennial leader in price ascension and fundamental innovation over the last several years is without a doubt technology stocks.
The overwhelmingly favorite benchmark for this group is the Technology SPDR ETF (XLK), which contains 76 large-cap technology companies. Household names such as Apple (AAPL), Alphabet (GOOG, GOOGL) and Microsoft (MSFT) are just some of the top holdings in this ETF.
XLK has nearly $13 billion in total assets, charges an expense ratio of 0.14% and is constructed with a market-cap weighted focus. This means that the largest companies make up the majority of the underlying assets, while smaller stocks are given a proportionally reduced slice of the pie.
Last year, XLK gained 5.47% in total return vs. 1.23% for the broad-based SPDR S&P 500 ETF (SPY). That calculation factors in dividends that shareholders in both funds would have received if they owned both over the entire 12-month span.
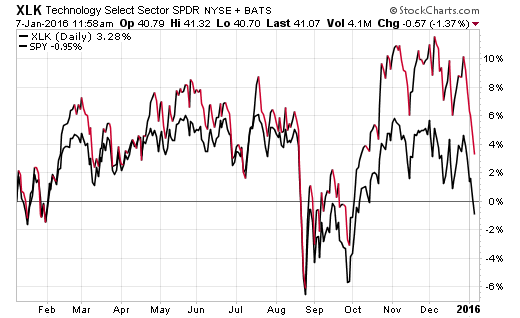
As you can see in the chart above, XLK really began to outperform after the summer 2015 correction led to a redistribution of momentum. This sector distanced itself from the pack as top technology stocks continued to attract buying interest.
Surprisingly, the biggest detractor from the overall performance of XLK has been its largest holding — Apple.
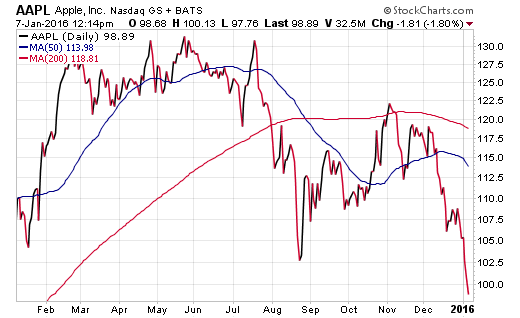
AAPL makes up nearly 14% of the XLK portfolio, which makes it a large pull on the performance of the fund. This stock recently hit new 52-week lows and is one of the reasons that marginal strength between SPY and XLK is narrowing to start the year.
It goes without saying that the performance of this single mega stock in 2016 is going to be a closely watched indicator for the technology group as a whole.
Moving back to XLK specifically, this index recently pierced back below its 200-day moving average (smooth red line) and is hunting for a sustainable level of support.
In my opinion, the next most logical area of support on the chart is $40.50. This is where the ETF bottomed in July and will likely represent a key turning point for the bulls. Any additional selling pressure may ultimately have this index test the September and October low near $38.50.
![]()
The bull case for technology is that this sector has proven to be an extremely resilient momentum group, able to rebound in quick fashion. Technicians will likely be drawn to the fact that the 200-day simple moving average is still sloping upward, which is a sign that this uptrend has yet to completely roll over.
Whether this current dip is a transitory event or the start of a new prolonged downtrend is up for debate at this stage. My advice is to not become overly bullish or bearish in either event.
Investors looking to purchase technology stocks should likely do so in incremental steps allowing for the advantage of time and price. Having a defined stop loss or risk management approach can help define the capital you are willing to commit to a rebound in this sector.
David Fabian is Managing Partner and Chief Operations Officer of FMD Capital Management. As of this writing, he did not hold a position in any of the aforementioned securities. Learn More: Why I love ETFs, And You Should Too.