Another day, another case of whiplash. Despite the strong start and an intraday gain of as much as 1.9%, the S&P 500 managed to give it all back … and then some. The index’s close of 2641.25 was 0.66% worse than Friday’s last trade.
And yet, that close was still well above the day’s low.
Boeing (NYSE:BA) did most of the damage, falling 6.6% largely on the heels of news that one of its 737 commercial passenger jets crashed. The cause and nature of the crash has yet to be determined, but traders weren’t unwilling to come to a conclusion that at least partially implicated the company.
At the other end of the spectrum Ford Motor (NYSE:F) was up another 3.3%, with investors continuing to celebrate last week’s encouraging earnings news and assurance that the dividend is intact. There just weren’t enough stories like Ford’s to do the market much good. Decliners almost doubled advancers.
That extreme volatility doesn’t mean there aren’t good trading opportunities. But, it does mean traders will want to choose carefully. Stock charts of Extra Space Storage (NYSE:EXR), Visa (NYSE:V) and Apple (NASDAQ:AAPL) are shaping up as some of the more reliable prospects. Here’s why.
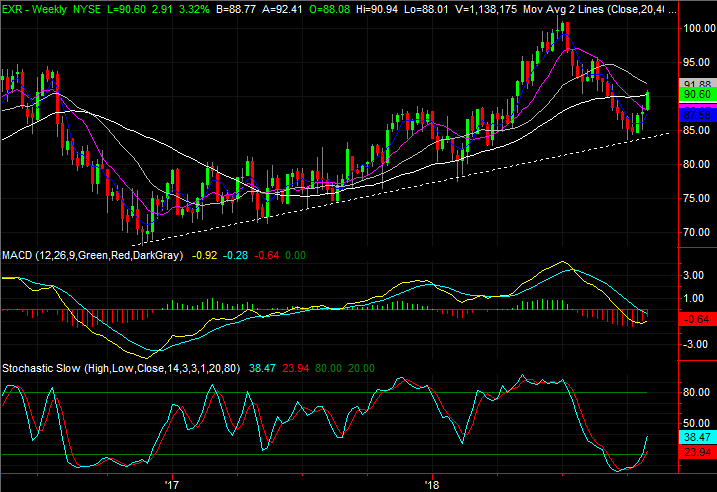
Extra Space Storage (EXR)
Most REITs have performed well of late, reflecting changes in the economic backdrop more so than major improvements in their business operations.
Shares of Extra Space Storage, however, are particularly interesting thanks to Monday’s big gain that confirms support was met a couple of weeks ago. If the pattern repeats itself, this could be the onset of a significant move higher.
Click to Enlarge
• Zooming out to the weekly chart it’s clear that the prompt for the current upswing is a brush of the rising support line, dashed, that’s tagged all of the major lows going back to early 2017.
• The scope of the potential runup from here could mirror the big gain seen between February and July. That was roughly a 22-point move.
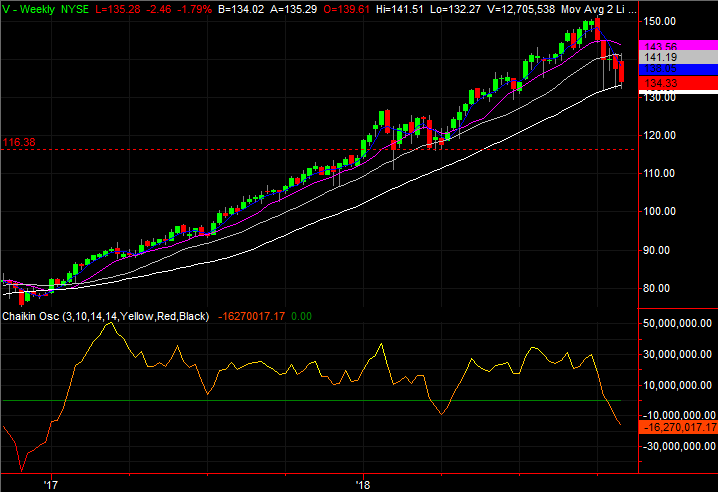
Visa (V)
Visa is essentially caught between a rock and a hard place. Early this month it broke below some key lines in the sand that have since become a technical ceiling. But, it has also found support at a familiar technical floor. One or the other has to break, and if the volume data is any indication, it’s the floor that’s more apt to break.
Click to Enlarge
• While V remains range-bound for now, there’s been decisively more bearish volume than bullish volume of late (save Thursday’s one-off).
• Should the 200-day moving average line ultimately fail to hold up as support, the weekly chart shows a massive amount of pullback potential. The next-best bet for a technical floor is around $116, near where shares found turbulence early this year.
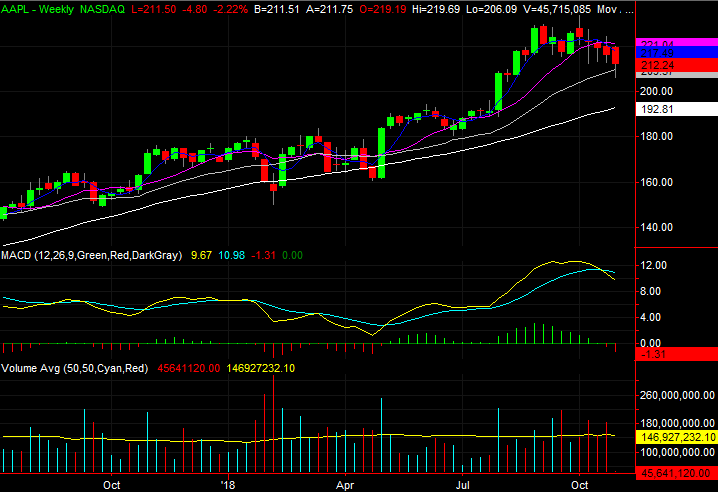
Apple (AAPL)
Finally, Apple was dissected on Friday, after failing to break under a key technical support level, but being unable to push its way back above some key technical resistance.
Nothing really changed on Friday, and in some ways nothing really changed on Monday. Monday’s intraday action from AAPL shares, however, may well force the traders on both sides of the table to go ahead and show their hands.
Click to Enlarge
• On an intraday basis things were alarming around mid-day, but the bulls stepped back in after the gray 100-day moving average line was kissed.
• The bulls are technically holding the line, so to speak, but their fight is getting tougher. One or two more bad days, particularly if the broad market continues to melt down, could push Apple shares over the edge.
As of this writing, James Brumley held a long position in Ford. You can follow him on Twitter, at @jbrumley.