
The markets remain very, very volatile as major market indices are retesting the lows for the month. Earnings have been strong for many companies, but that hasn’t been enough to support their elevated stock prices. Investors are selling first and evaluating second. Amid this volatile earnings seasons, let’s check out our top stock charts for Thursday morning.
Top Stock Charts for Tomorrow #1: Ford
Click to Enlarge
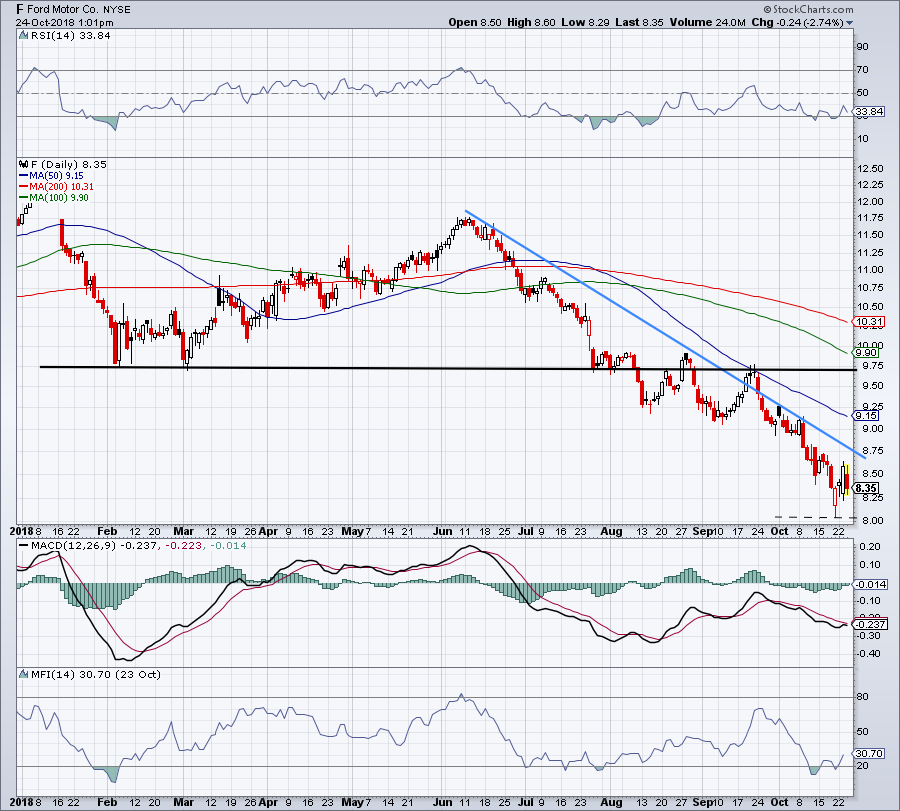
Ford (NYSE:F) has had a very rough go of as of late. But on Wednesday after the close, the company will report its quarterly results. Investors are seeking reassurance on its dividend and will want an update on the company’s restructuring plan.
Down about 30% for the year, Ford stock has been in a world of pain. Not even its 7.1% dividend yield can make investors feel much better. I am glad to see the stock selling off somewhat into the report though. A multi-day rally into the event would almost surely set it up for failure.
Here’s what I’d love to see: A so-so earnings report that’s sold into in the after-hours and perhaps even into the early part of Thursday’s regular trading session. Ideally Ford would make new lows, but then reverse and close green on the day. That could put a bottom in the stock.
Top Stock Charts for Tomorrow #2: Advanced Micro Devices
Click to Enlarge
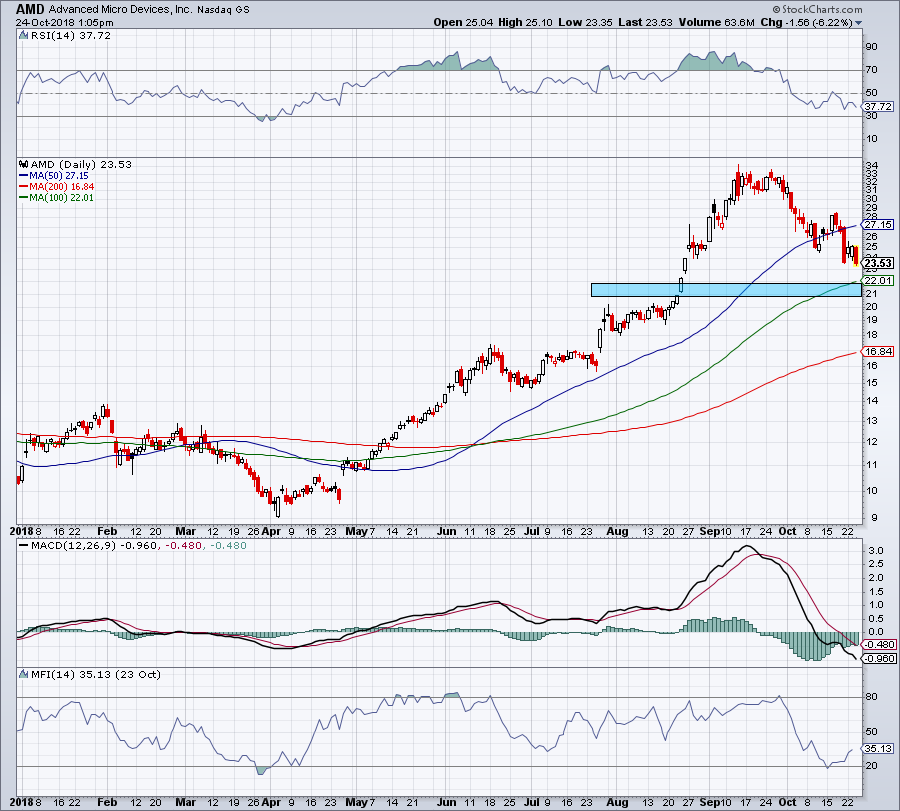
Advanced Micro Devices (NASDAQ:AMD) will also report earnings after the close. Like many others in its space, including Nvidia (NASDAQ:NVDA) and Intel (NASDAQ:INTC), it’s been roughed up pretty bad.
It’s a tempting long down over 7% ahead of the report. Heck, shares are down 15% over the past five trading sessions. That’s horrible!
The problem we have to contend with on earnings are the gap moves. Should we buy AMD, all risk parameters go out the window should it gap down 10% on Thursday morning.
That being said, I would love a chance to buy AMD down near $21 to $22, a slight decline from current levels. We’d test the 100-day at $22, the 50% Fibonacci retracement level for the 52-week range at $21.61 and fill the gap-up from August at $21.
It would be tempting to buy AMD right now if it weren’t for the market’s current climate. Below Friday’s lows and it’s too hard for me to trust AMD. Let’s see the post-earnings move. On a rally, see it can get above and more importantly stay above the $25.50 level.
Top Stock Charts for Tomorrow #3: Realty Income
Click to Enlarge
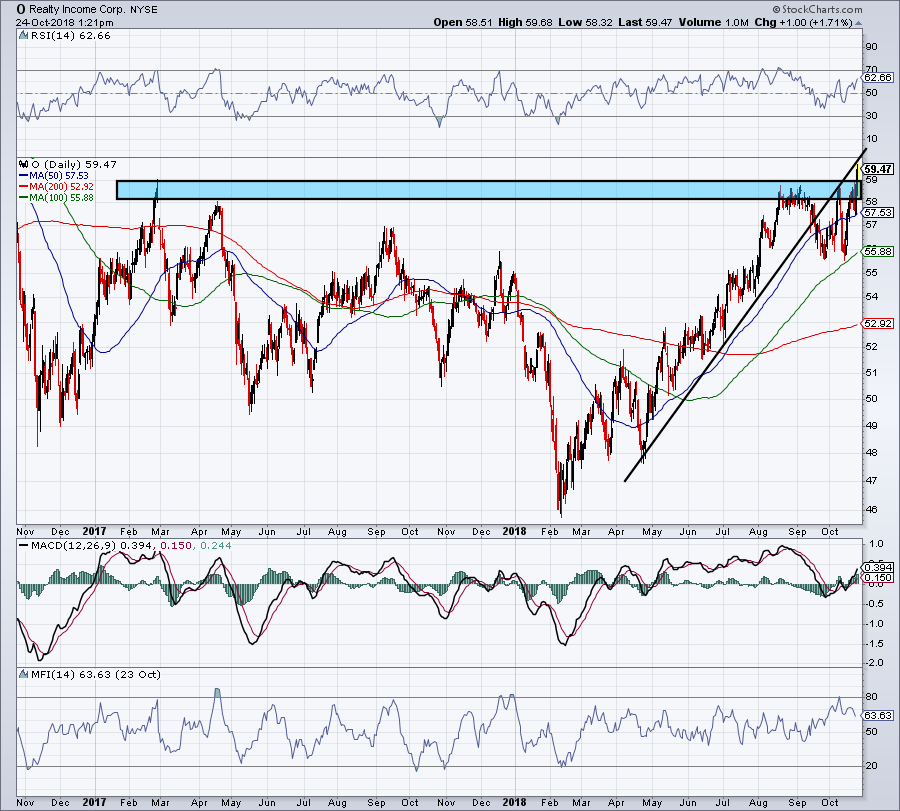
I have a small cluster of REIT stocks, consisting of Ventas (NYSE:VTR), Digital Realty (NYSE:DLR) and Realty Income (NYSE:O). The last one, O, is perhaps one of the best-known REITs in the market.
I’m glad I own all three, (not that I have been immune to other losses). But this group continues to do well. Specifically, O has been strong and looks to be breaking out to new highs. Above $59 and shares could continue to migrate higher. Do look for the backside of prior uptrend support (black line) to see if it gives O any trouble, though.
The risk here of course is that the market begins to rally. Should it do so, we could go from a “risk off” environment, where REITs, utilities and quality dividend stocks do the best, to a “risk on” environment, where tech and momentum names perform best.
Short-term investors can go long O and use $58 to $58.50 as their stop-loss. Those who don’t mind holding through some potential downside can just use the 50-day moving average as their stop-loss. Longer term investors can consider buying on pullbacks of 5% to 10% and holding for the long-term.
Top Stock Charts for Tomorrow #4: Texas Instruments
Click to Enlarge
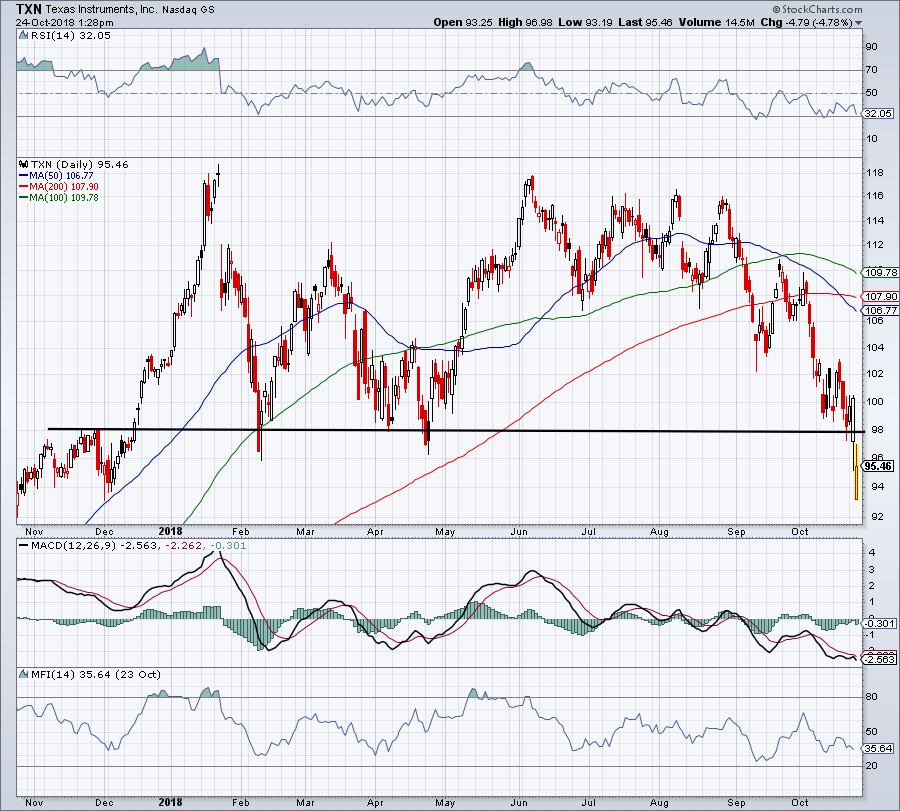
Like other semi stocks, Texas Instruments (NASDAQ:TXN) has been getting absolutely hammered. Wednesday’s 5% post-earnings selloff isn’t helping matters.
Let’s keep it simple. With shares reversing off the lows, aggressive buyers can go long with a stop-loss below today’s lows. Conservative investors will want to wait for a close above $98. Above that mark and TXN looks much better, especially with all three major moving averages near $107 and above.
Given the market’s current condition, I’m in no rush to take on new, unnecessary risk, personally.
Top Stock Charts for Tomorrow #5: Netflix
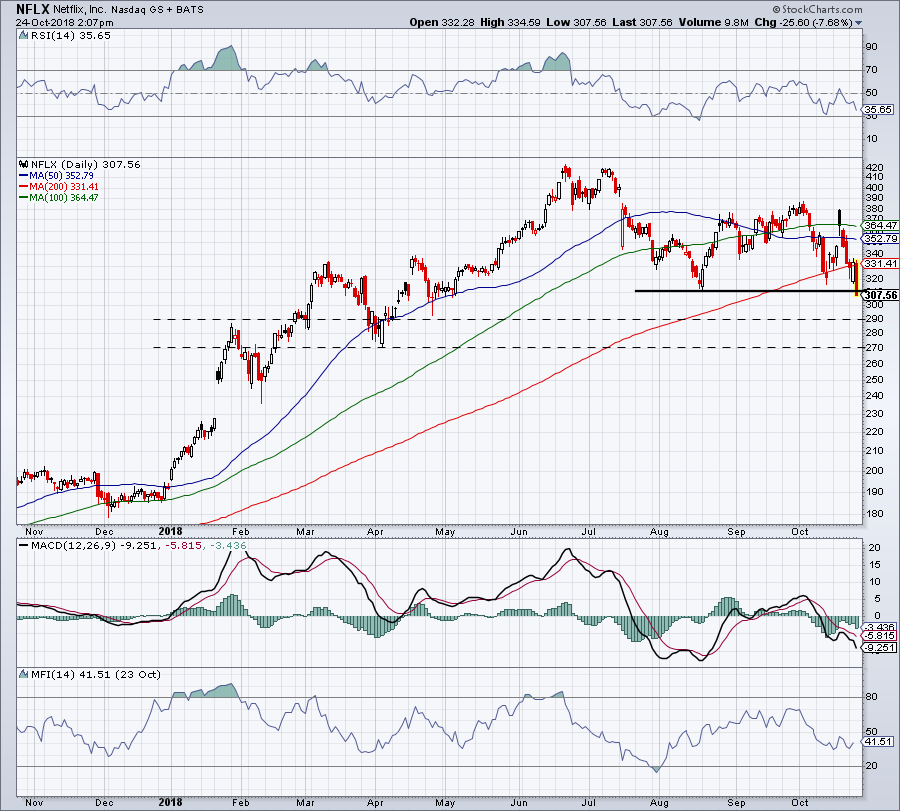
Click to Enlarge
Netflix (NASDAQ:NFLX) is another name that has been hammered, with Wednesday’s 9% decline highlighting the recent beating. Worse though, shares are now below 2018’s second-half lows.
A rebound back above this $310-ish level could get NFLX back up to the 200-day. Should it fail there though, the bulls will be dealt a major blow. Should NFLX continue lower, the $290 level and $270 level could be next.
While its 50% Fibonacci retracement sits near $300, its 61.8% retracement rests near $270. Let’s see how it shapes up the rest of this month.
Bret Kenwell is the manager and author of Future Blue Chips and is on Twitter @BretKenwell. As of this writing, Bret Kenwell is long NVDA, O, VTR and DLR.