Wow! What a comeback. Down as much as 2.9% at one point on Thursday, the S&P 500 came roaring back by the time the closing bell rang. The loss for the session was pared back to a palatable 0.15%.
Amazon.com (NASDAQ:AMZN) has to get most of the credit for leading the recovery effort. Shares of the e-commerce giant ended yesterday’s action up 1.9% mostly because traders love to love Amazon during busy shopping times.
At the other end of the spectrum, one can’t help but wonder if the market would have managed to climb all the way back into the black had it not been weighed down by Bank of America (NYSE:BAC) and Boeing (NYSE:BA). BofA was under pressure to the tune of 2.7%, along with most of its banking peers, on fears of what impact a more thorough interest rate inversion may have on its business. Aircraft icon Boeing, meanwhile, saw its shares slump 3.1% on worries that the China/U.S. trade war will escalate rather than abate.
Between Tuesday’s outrageous drubbing, Thursday’s bearish gap and yesterday’s stunning reversal, most trends developing on stock charts have been obliterated. From here, picking stocks requires a little more faith than usual. Still, the stock charts of Twitter (NYSE:TWTR), Prologis (NYSE:PLD) and Kroger (NYSE:KR) have dropped more than their fair share of hints about what lies ahead, and those clues are mostly bullish.
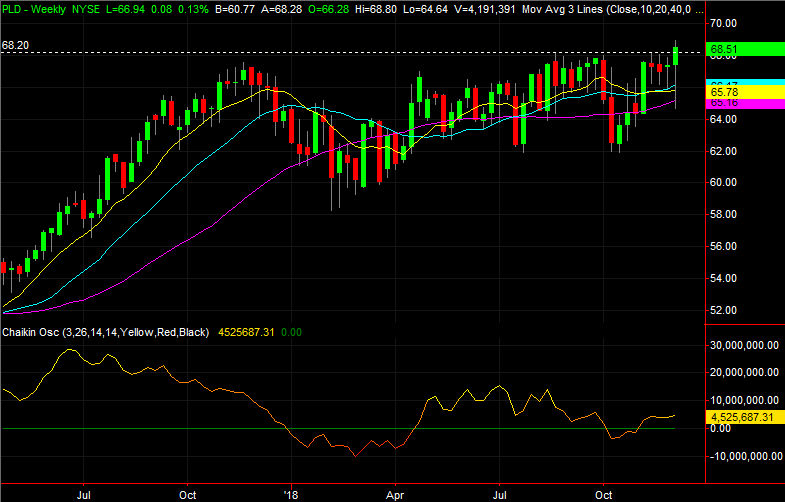
Prologis (PLD)

Prologis is a name that may ring a bell. We’ve examined it several times, with each look essentially focusing on the trading range that has bound it for the past several months.
As of Thursday, the upped edge of that trading range has been breached. Better yet, the circumstances of that move strongly underscores the likelihood of more upside.
Click to Enlarge
• Ultimately prompting Thursday’s pop was an encounter with the 200-day moving average line, plotted in green. That’s exactly where a reversal should have taken shape.
• Zooming out to a weekly chart, we can see the Chaikin line crossed back above zero last month, showing this rekindled uptrend is backed by solid volume.
Twitter (TWTR)
Twitter isn’t in a roaring uptrend. But, curiously, TWTR has largely escaped the worst of the market’s recent tumbles. That’s a subtle hint of buyers waiting in the wings, respectful of the forward progress that company has been able to generate of late.
While not over the hump and on the rise, it’s pretty clear where the make-or-break ceiling is. The right move could unleash a wave of bullishness that may quietly be pent-up here.

Click to Enlarge
• While TWTR has been mostly stagnant of late, the buying volume continues to build.
• Beckoning the stock higher may be the bearish gap left behind in July. The upper end of that gap range is around $42, and marked with a yellow dashed line.
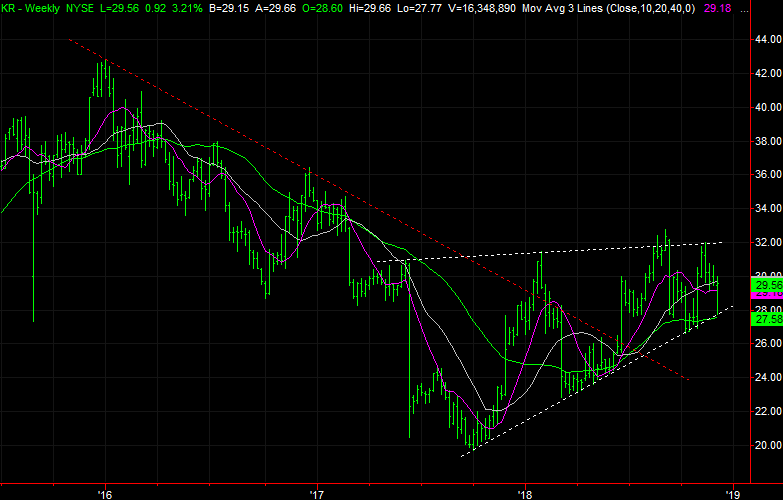
Kroger (KR)
Finally, our last look at Kroger back on Oct. 24 pointed out the stock had just brushed a long-term support level and was likely to race back to an established resistance line. That happened. KR only had to brush that boundary around $32 before rolling over.
Thing is, though things were hairy and scary for KR on Thursday, a mere brush of that familiar floor sparked a rebound that’s once again likely to push Kroger back to that familiar ceiling.
Click to Enlarge
• The shape of Thursday’s bar is meaningful in and of itself. The scope of the intraday reversal on a volume surge suggests there were a bunch of buyers waiting in the wings.
• Although the stock has been trapped between a floor and a ceiling since 2017, the upward direction of the converging wedge shape is one that ultimately says the stock’s going to be catapulted higher. Also on the weekly chart, it’s easy to see the falling ceiling of 2016 and 2017, plotted in red, has already been breached, and we’ve been logging higher lows since late-2017. The undertow has already turned bullish.
As of this writing, James Brumley did not hold a position in any of the aforementioned securities. You can follow him on Twitter, at @jbrumley.