Although it spent most of the day in the black, when push came to shove at the end of the day, the S&P 500 ended Wednesday in the red. It was the second straight day of modest losses, but underscored by rising bearish volume.
 Bank of America (NYSE:BAC) set the tone, if not the pace, falling 3.4% largely thanks to news that the Federal Reserve was dialing back its plans to raise interest rates this year. Lower interest rates general translate into modest bank profits. Rivals Citigroup (NYSE:C) and Wells Fargo (NYSE:WFC) booked oversized losses too, however.
At the other end of the spectrum, Netflix (NASDAQ:NFLX) jumped 4.6% on bullish comments from RBC analyst Mark Mahaney. Mahaney cites, among other things, continued positive perceptions from its customers and the fact that new competition underscores the further legitimization of the alternative to traditional cable television.
None of those tickers make for particularly great trading today, however. Rather, it’s the stock charts of Marathon Oil (NYSE:MRO), Freeport-McMoRan (NYSE:FCX) and 3M (NYSE:
MMM) of the most interest. Here’s why.
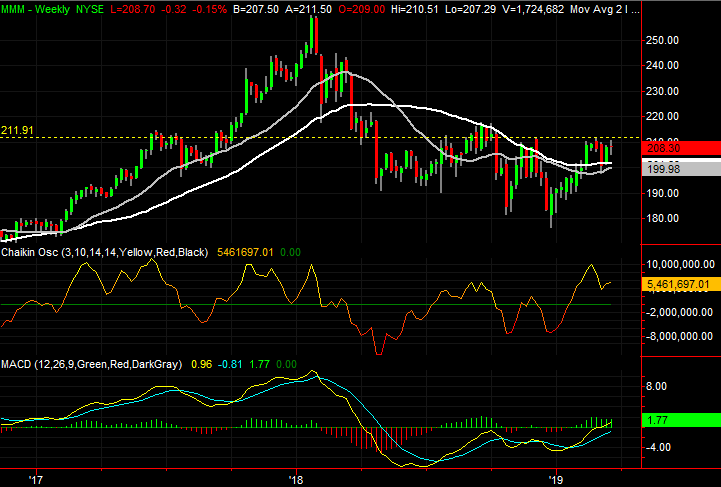
3M (NYSE:MMM)
It’s not over the final hump just yet, but 3M stock is knocking on that door. And, it’s doing so with the most bullish of backdrops.
If MMM can muster one more big thrust, it could set off a chain reaction of buying that may well reclaim much of what was lost in 2018.
Click to Enlarge
• As of today, the purple 50-day moving average line is above the white 200-day moving average line. This so-called “golden cross” generally portends more bullishness.
• It was the February setback and rebound that got the breakout effort renewed in perfect form. The gray 100-day and the 50-day moving average lines both acted as the support they needed to be … something neither had done in some time.
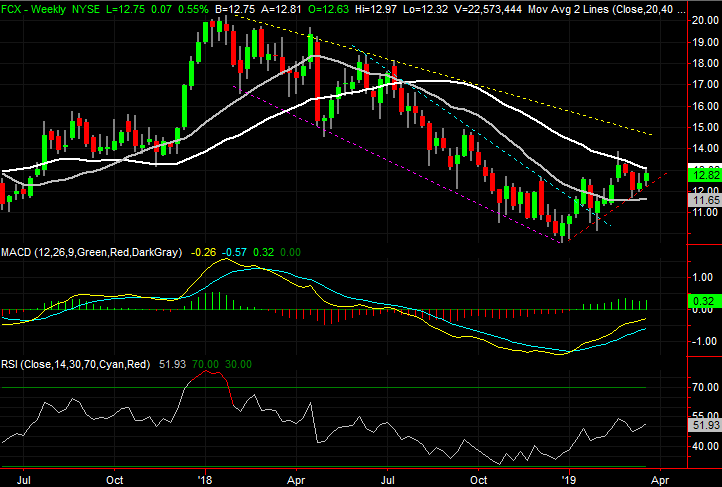
Freeport-McMoRan (FCX)
Back on Feb. 20, Freeport-McMoRan was highlighted as a breakout candidate. Shares had then-recently pushed through a couple of technical resistance levels, and were acting as if they were ready and willing to keep trucking.
They didn’t. After hitting their 200-day line that very day, the profit-takers came out of the woodwork. The bigger-picture bullish effort has been renewed though, exactly where and how it needed to. The next dance with the 200-day moving average line, plotted in white on both stock charts, could prove a bullish catalyst.
Click to Enlarge
• Although the volume is still below average, notice that the selling volume was waning on the way down, while the bullish volume has been building on the way up this week.
• The white 200-day moving average line near $13.40 is still likely to act as resistance, but if it yields to the uptrend, there’s little left that stands in the way. The next line in the sand is around $14.50, which lines up with the major peaks hit in the first half of last year.
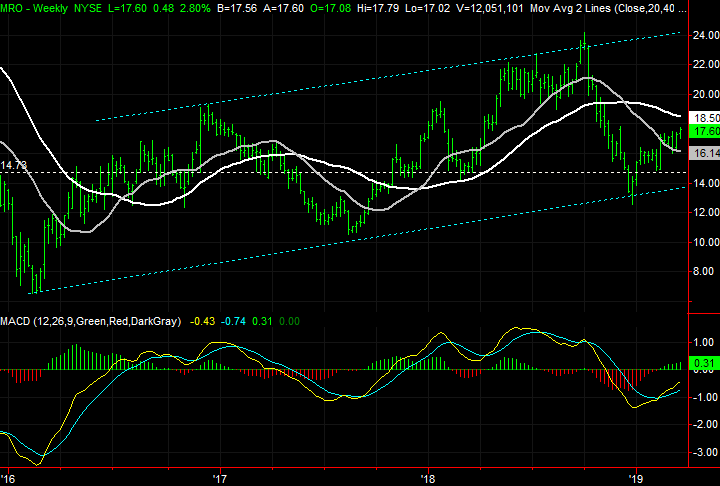
Marathon Oil (MRO)
Finally, Marathon Oil is at an inflection point. Most oil and energy names are, prodded by rising oil and gas prices in an environment that suggests the slow uptrend is built to last. More than most other tickers from the energy sector though, MRO is well-positioned for a sizeable move higher.
Click to Enlarge
• Like many other stocks, MRO is pushing up and off of support offered by the purple 50-day moving average line early this month.
• Zooming out to the weekly chart of Marathon, we find that the December low is also a push up and off the same support line that has guided shares higher since 2016’s bottom. Assuming the upper boundary of the range remains in play, MRO could rally back to at least $24 before hitting its ultimate resistance.
As of this writing, James Brumley did not hold a position in any of the aforementioned securities. You can learn more about James at his site, jamesbrumley.com, or follow him on Twitter, at @jbrumley.