Just one day after stocks logged their best-ever close, the bulls backed down. By the time the closing bell rang, the S&P 500 had fallen 0.22% to end the session at 2,927.25, almost closing at its low for the day.

AT&T (NYSE:T) did a great deal of that damage, falling a little more than 4% after first-quarter numbers fell short of expectations. Its TV business was a particularly sore spot, though its wireless arm wasn’t exactly stellar last quarter either. Snap (NYSE:SNAP) technically lost more ground though, ending the day down a bit more than 6% after surging in response to a surprisingly progressive first quarter.
There were some winners, albeit few and far between. Anadarko Petroleum (NYSE:APC) rallied another 11% after Occidental Petroleum (NYSE:OXY) made a bid that topped the previous acquisition offer from Chevron (NYSE:CVX).
The indecisive environment means traders would be wise to choose prospects carefully and pick names from both sides of the bullish/bearish fence. The stock charts of Norfolk Southern (NYSE:NSC), Bristol-Myers Squibb (NYSE:BMY
) and Discovery Communications (NASDAQ:DISCA) make for a good place to start that open-minded search.
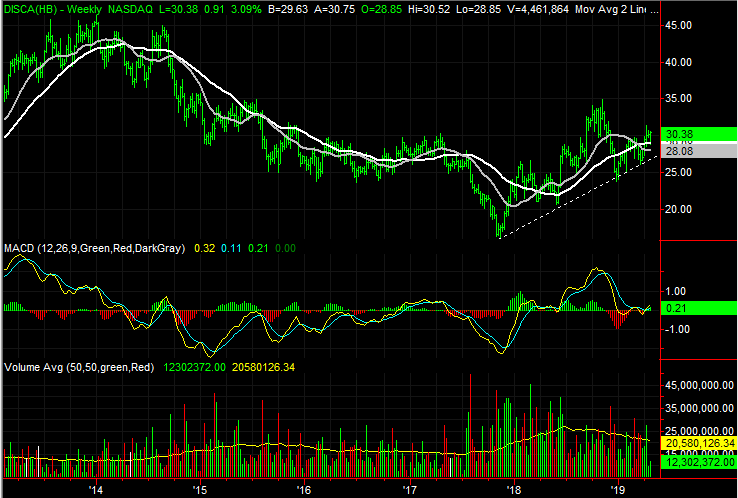
Discovery Communications (DISCA)
Just a few weeks ago, Discovery Communications shares were in fairly serious trouble. Resistance had been met multiple times at multiple moving average lines, and a so-called ‘death cross’ had taken shape. The stock was just one bad day away from a meltdown.
That disaster has been avoided though. In fact, the rebound effort from two weeks ago has been confirmed and strengthened this week by virtue of support provided by a couple of those key moving average lines.
Click to Enlarge
- The confirmation of the new uptrend is yesterday’s brush of the white 200-day moving average line. DISCA stock only had to kiss it to surge higher, renewing the cross above the long-term line in early April.
- The weekly chart puts matters in more perspective. Although erratic, the rally that got going in March was spurred by a fresh encounter with a support line that tags all the key lows going back to late 2017.
- As tempting as it may be to want to use a prior peak as a potential ceiling, or upside target, this may not be a case where those levels serve as reliable, or even likely, stopping points for any advance.
Norfolk Southern (NSC)
Railroad name Norfolk Southern had a terrific run from its late-December lows, outpacing most other stocks. All good things must come to an end though, and a couple of red flags started to wave for NSC stock yesterday.

Click to Enlarge
- The shape of Tuesday’s bar is telling. The open and close near the low of a relatively tall bar suggests an intraday transition from a net-buying to a net-selling environment.
- Bolstering the bearish case here is the gap left behind by yesterday’s jump. Generally speaking, gaps tend to get filled in. In this case, the sheer size of the four-month rally adds weight.
- Zooming out to the weekly chart we can see Norfolk Southern shares kissed a long-established resistance line on Wednesday, becoming overbought, as highlighted by the RSI’s move above 70.
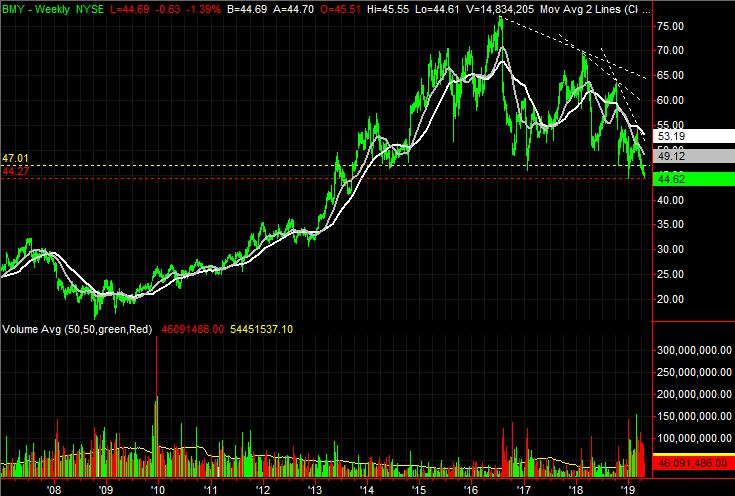
Bristol-Myers Squibb (BMY)
When we last looked at Bristol-Myers Squibb back on April 8, it was trying to move lower, but had thus far been unable to push under a technical support level around $46.
That’s no longer the case, though there’s a new support line now in play. Even so, the backdrop suggests there’s already a great deal of bearish momentum in place. If the current technical floor breaks, there’s nothing left to stop the next round of selloffs.
Click to Enlarge
- While the previous floor around $46, marked with a yellow dashed line on both stock charts, is broken, the current one at $44.31 marked with a red dashed line is nothing to dismiss.
- While not yet under a major floor, note the swell of selling volume seen since March. This is a new development; the more the stock slumps, the more investors trickle out.
- Even if support around $44.31 breaks, it’s likely we’ll continue to see some wide ebbs and flows that make for nice swing-trading opportunities.
As of this writing, James Brumley did not hold a position in any of the aforementioned securities. You can learn more about James at his site, jamesbrumley.com, or follow him on Twitter, at @jbrumley.