Understanding what levels and trends are important can lead to successful trading.
In financial markets, there are certain price levels that are more significant than others with regards to the amount of supply and demand that exists at them. In addition, prices are always doing one of three things. They are either going up, going down or staying the same. If you understand these dynamics it would help your trading or investing strategies.
Don’t waste your time with things like Gann Theory, Harmonic Patterns or Elliot Waves. These things are like Bigfoot and UFOs … fun to talk about but hardly credible. I can tell you that in the 20 years I spent as a hedge fund trader, not once did I ever hear a portfolio manager or trader talk about them. What do successful traders look at? Important levels and trends.
I think that the S&P 500 will be neutral to slightly down this week. This is because many of the economic sectors that make up the S&P 500 are overbought and are at resistance levels.
S&P 500 SPDR: The SPYs are overbought and near levels that were resistance in the past. There will probably be resistance around the $293 level because it is where the top was in September and October.
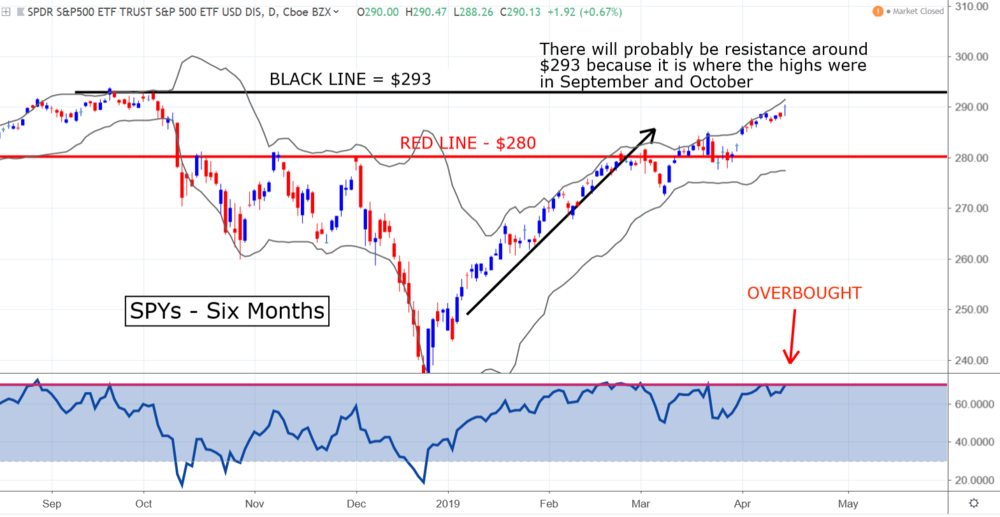
If they head lower there will probably be support around $280. The $280 level is important because it was resistance during last March, June and again from October through December. It was also support throughout last July.

Technology SPDR: The XLKs are overbought and testing important resistance. There is resistance around the $76 level because this is where the highs were last August through October. If they head lower there will probably be support around the $72 level because it was the top of the recent range.

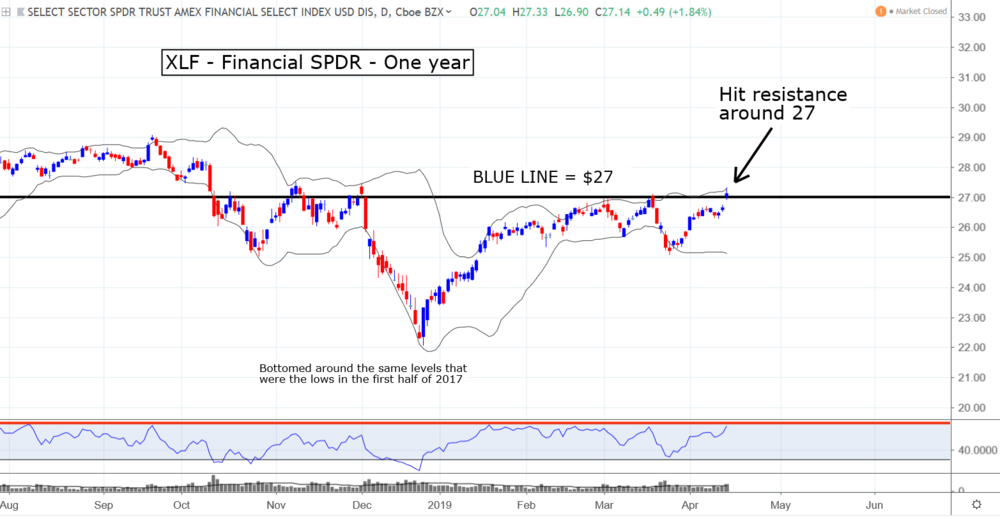
Financials SPDR: The XLFs hit resistance around the $27 level. They are slightly overbought. The levels between $27 and $27.50 have been the top of the range since November.
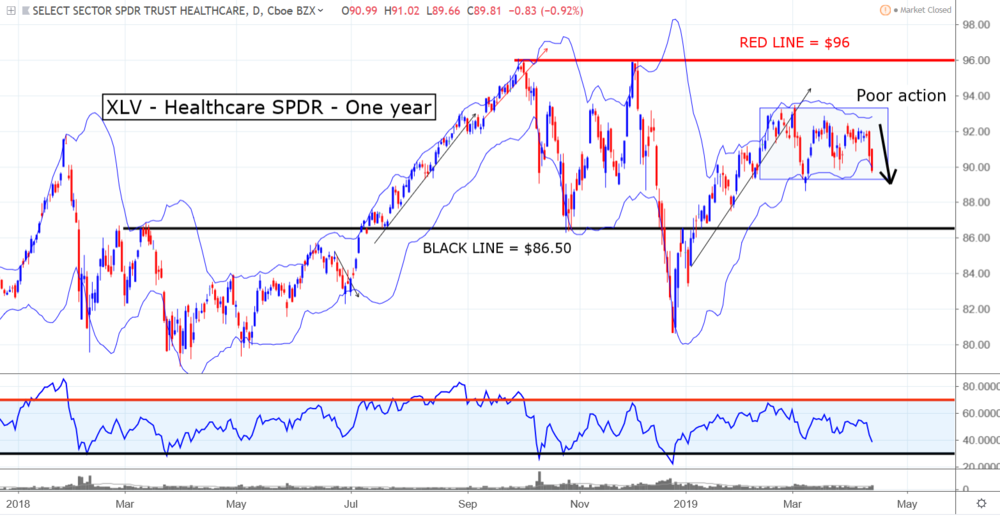
Healthcare SPDR: The XLVs are at the bottom of the range that they have been in since February. The action over the past two days has been very weak. If they head lower there may be support around $86.50. It was the top in March and the bottom in October of 2018.
Consumer Discretionary SPDR: The XLYs testing resistance around the October highs. They are very overbought, so there will probably be some consolidation or profit-taking. If they head lower there will probably be support around $111 because it was a resistance level from early December through March.

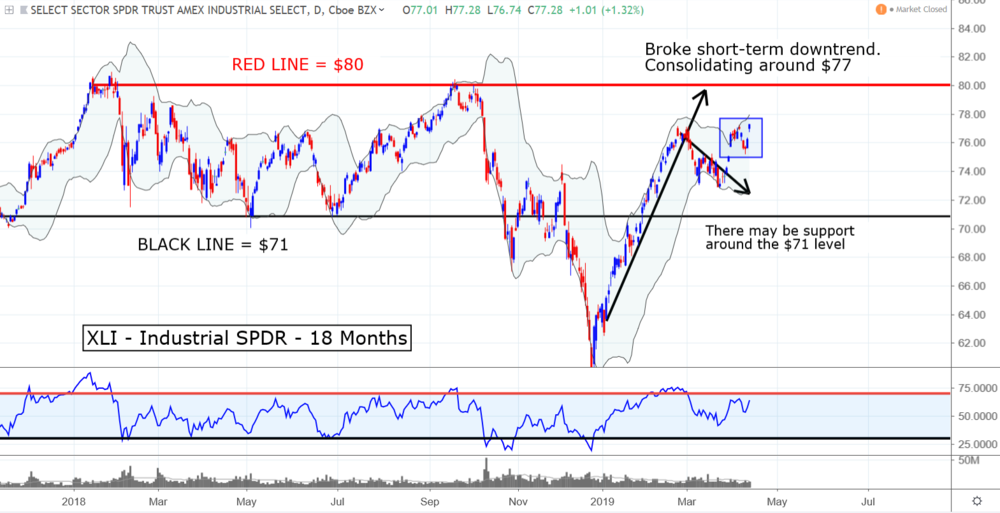
Industrials SPDR: The XLIs broke their short-term downtrend and are consolidating around the $77 level. Longer-term, there may be resistance around the $80 level because it is where the highs were in January and September of 2018. There may be support again around $71 because it is where the lows were in late 2017 and the first half of 2018.
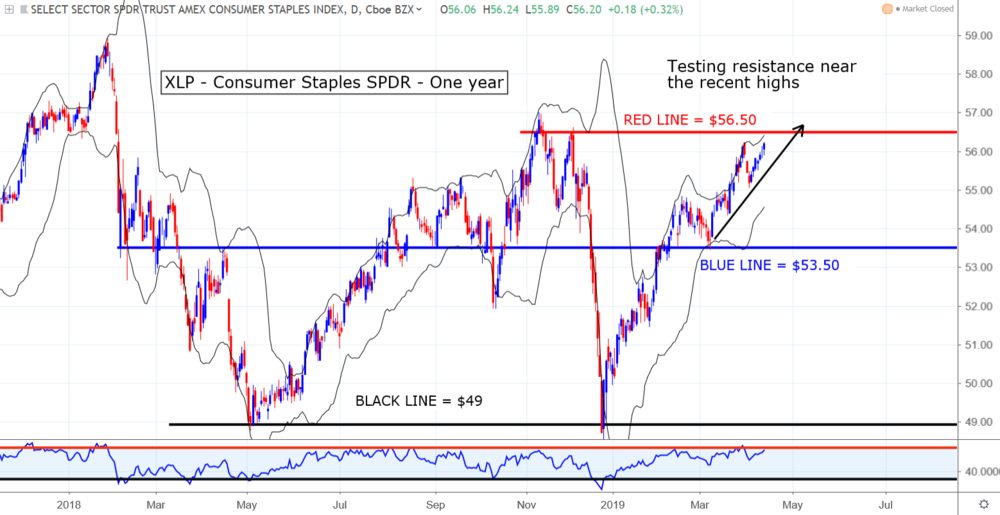
Consumer Staples SPDR: The XLPs are testing resistance around the levels that were the highs at the end of last year. They are slightly overbought. They found support around the $50 level during the selloff at the end of December. This level was the low in 2016, and the top of the range throughout 2015.
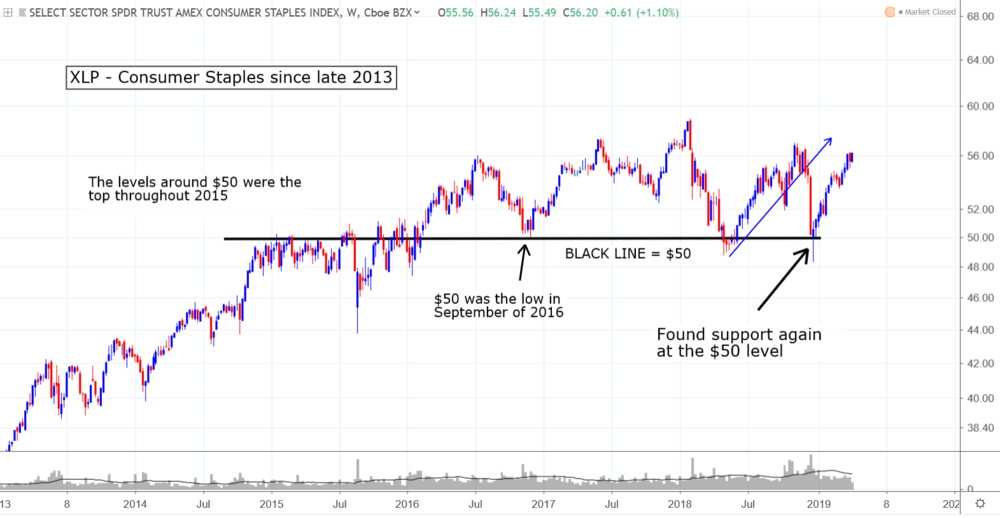
Consumer Staples SPDR Long-Term: The XLPs recently found support again around the very important $50 level. This level was the low in 2016, and the top of the range throughout 2015. It was also the top of the range during this past May.
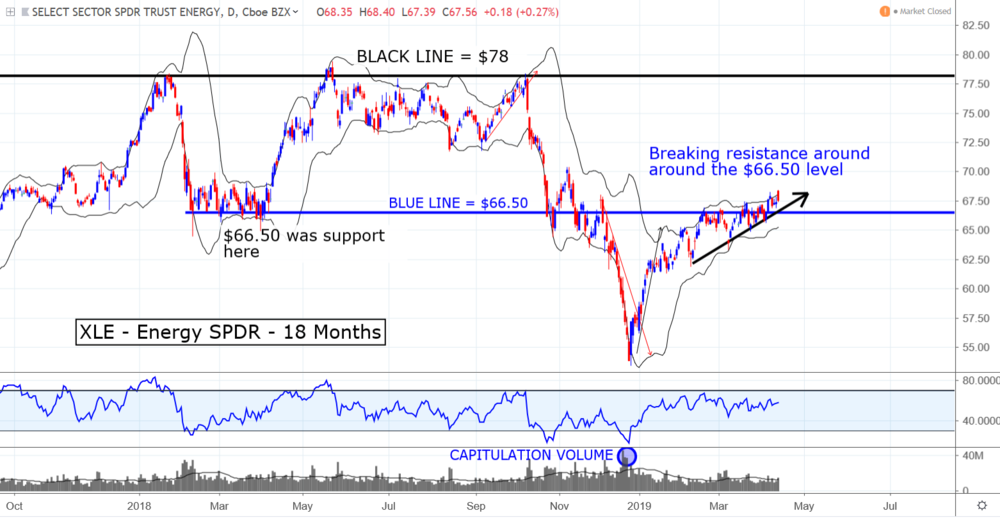
Energy SPDR: The XLEs seem to be breaking the resistance around the $66.50 level. This level has been resistance for the past two months. There is resistance around this level because it was support in early 2018.
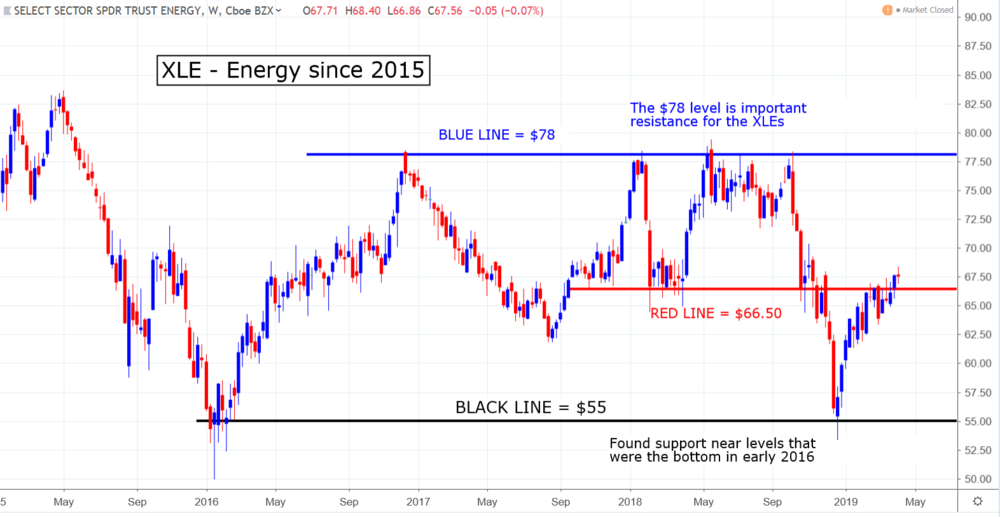
Energy SPDR Long-Term: The XLEs could be breaking resistance around the $66.50 level. There is resistance here because it was support a year ago. The $78 level is important long-term resistance. The levels around $55 are important long-term support.
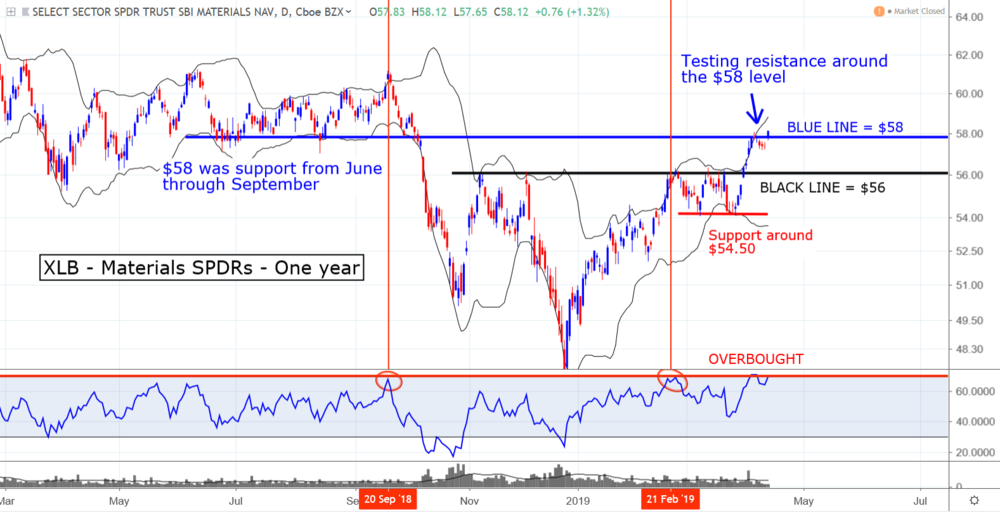
Materials SPDR: The XLBs are testing resistance around the $58 level. This level was the bottom of the range from last June through September. They are very overbought. The last two times that they were this overbought, in September and February, a selloff followed.
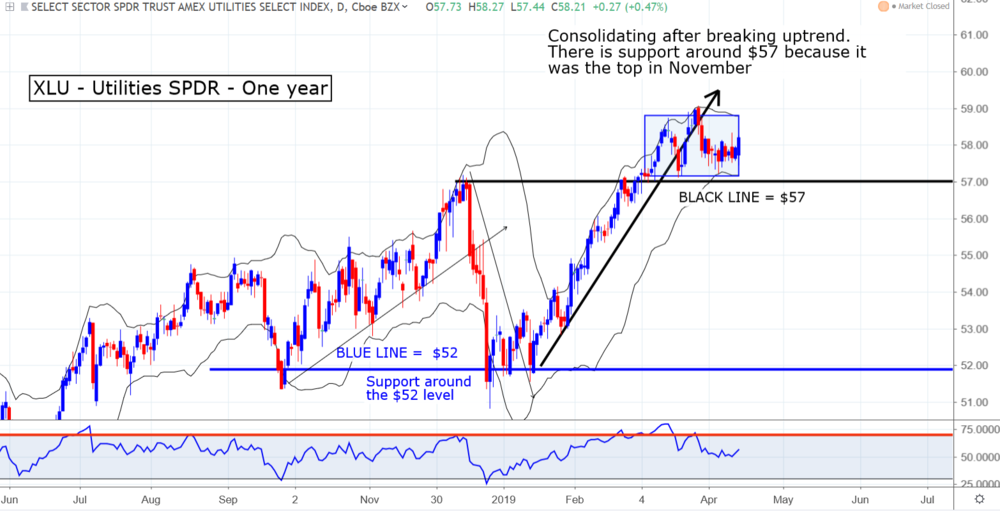
Utilities SPDR: The XLUs broke their recent uptrend after becoming overbought and are consolidating. There is support around the $57 level because this is where the highs were in December. In September and then again in late December and early January they found support around the $52 level.
As of this writing, Mark Putrino did not hold a position in any of the aforementioned securities.