Once again the market fought its way off of intraday lows, but Friday’s instance was remarkably different in that for the first time in four sessions, the S&P 500 was able to fight its way out of the red and into the black. The index was up 0.37% on the last trading day of last week, ultimately supported at a key technical level.

Cronos Group (NASDAQ:CRON) did some of the heavy lifting, up more than 9%, snapping back from Thursday’s weakness after the market had a chance to digest last quarter’s earnings. Rival Tilray (NASDAQ:TLRY) rallied more than 7%, inspired by Cronos’ strength.
At the other end of the spectrum, Uber Technologies (NYSE:UBER) fell more than 7% in its trading debut, dragging shares of rival Lyft (NASDAQ:LYFT) with it by the same amount. While both recent IPOs managed to create a buzz, more than a few investors see flaws with the business model.
Headed into today’s trading action, the stock charts of Walmart (NYSE:WMT), Keysight Technologies (NYSE:KEYS) and Fifth Third Bancorp (NASDAQ:
FITB) are the names worth a closer look. Here’s why.
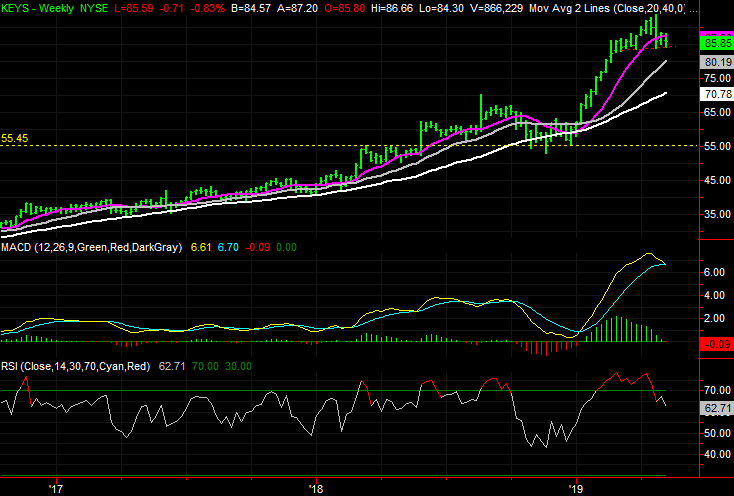
Keysight Technologies (KEYS)
Keysight Technologies had a great beginning to the new year, rallying from $56 to nearly $86 by late February. The advance slowed down then but it remained intact … until the latter part of last month.
That’s when the rally broke down. It hasn’t broken below a key support level yet. In fact, that support level has become even better defined since then. The sellers continue to put pressure on that floor though, and there’s a ton of room to tumble if it breaks.
Click to Enlarge
- The technical floor in question is plotted in red on both stock charts. Friday’s low was once again right at that mark.
- You can see it on the daily chart, but to fully appreciate the scope of the red-hot runup in January and February, the weekly chart is far more telling.
- Not only has Keysight fallen below its purple 50-day moving average line, the weekly chart just made a fresh bearish MACD crossunder.
- The most plausible downside target from here, should the floor near $84.30 snap, is the December low near $56.
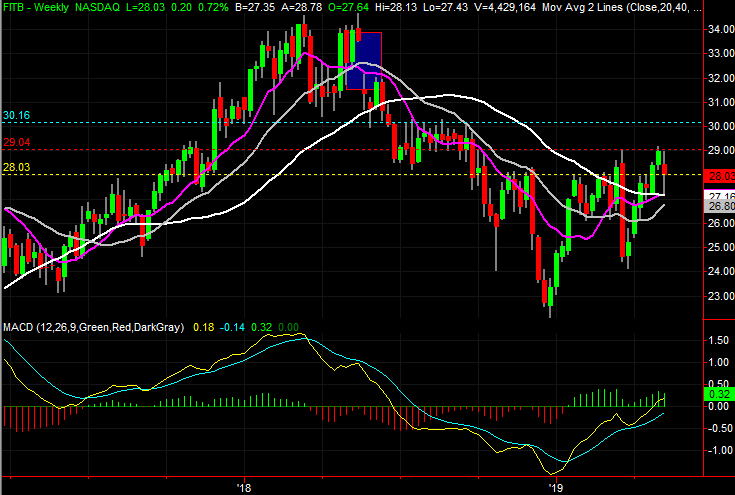
Fifth Third Bancorp (FITB)
When we last looked at Fifth Third Bancorp back on April 23, it was in an encouraging uptrend, though not yet past a key technical resistance level. It was, however, above all of its key moving average lines. It blasted past that first technical ceiling in the meantime, though was stopped cold at another, previously established ceiling. That stall eventually led into last week’s pullback.
That slide may actually have been the best thing for the budding uptrend. Not only were a couple of key moving averages confirmed as technical support, but the time has also allowed another key bullish sign to almost take shape.
Click to Enlarge
- The horizontal resistance in question is around $29.05, plotted in red on both stock charts. Fifth Third shares peaked there in March, and again last month. The bears have drawn a line in the sand.
- Although it peeled back last week, notice the selling was halted and started to reverse course as the white 200-day and purple 50-day moving average lines were revisited. In fact, the 50-day line is close to crossing above the 200-day average, yielding a so-called golden cross.
- If the ceiling at $29.05 is unable to hold the buyers back, the next ceiling is around $30.15 where the stock struggled in July and August of last year. Past that, there’s little that will hold the stock back.
- Beckoning FITB above $30.15 is the big gap left behind in May of last year (highlighted).
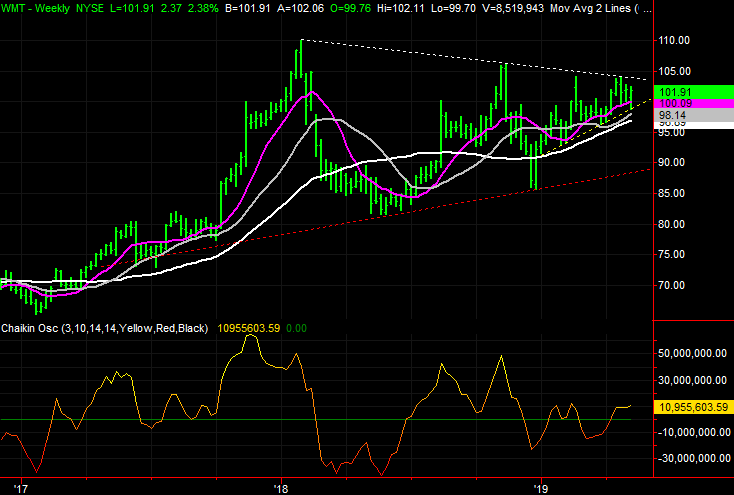
Walmart (WMT)
Finally, Walmart shares may have been little more than a choppy, inconsistent mess since early last year. But, there has been a method to the madness the whole time. The stock has been trapped in a converging wedge pattern.
It’s still stuck in that rut too. However, the upper boundary of that narrowing range is increasingly being pressured, and new, higher support lines are taking shape that could easily fuel a breakout thrust.
Click to Enlarge
- The upper edge of the converging wedge pattern tags all the major highs going back to February of last year. It’s plotted in white on both stock charts.
- Zooming out to the weekly chart puts the narrowing wedge pattern in perspective. The lower boundary of that shape is marked in red.
- Since January, a new support line has taken shape, plotted in yellow on both stock charts. Keeping the stock closer to the upper edge of its trading range also keeps it better positioned for a move past it.
As of this writing, James Brumley did not hold a position in any of the aforementioned securities. You can learn more about James at his site, jamesbrumley.com, or follow him on Twitter, at @jbrumley.