The bears pushed back, again, lengthening what has become some very indecisive action for stocks. The S&P 500’s modest 0.28% slide wasn’t terrifying, but it did represent another failed effort to crawl back above its key 50-day moving average line.

Qualcomm (NASDAQ:QCOM) led the way, tumbling almost 11% in response to reports that it has been found in violation of U.S. antitrust laws. Sprint (NYSE:S) wasn’t far behind though, with its 7.6% setback after the Department of Justice recommended its impending merger with T-Mobile (NASDAQ:TMUS) be blocked.
While not nearly as many, there were a handful of winners on Wednesday. Chief among them was Target (NYSE:TGT). Shares of the retailer rallied almost 8% yesterday on the heels of an encouraging Q1 print.
None of those names are especially compelling trading prospects headed into today’s session, however. Rather, it’s the stock charts of Cadence Design Systems (NASDAQ:CDNS), Nordstrom (NYSE:JWN) and Under Armour (NYSE:
UAA) that are worth the closer looks.
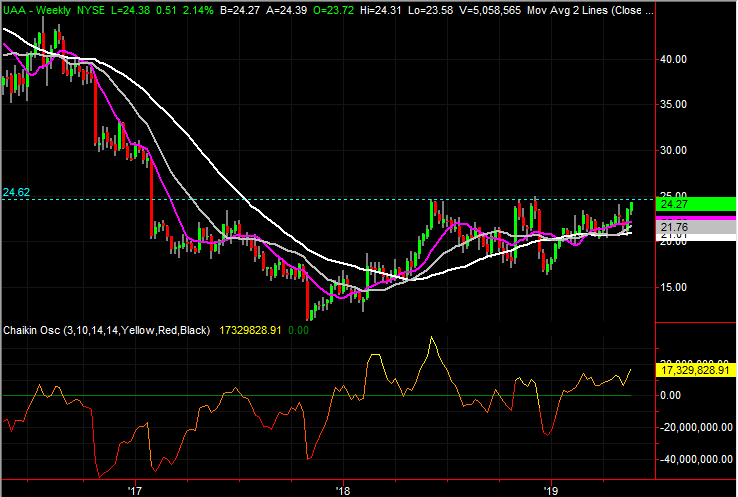
Under Armour (UAA)
Athletic apparel company Under Armour is a well-known brand, but years of expensive decisions caught up with the company in 2016. Nervous investors finally expressed their concern with a steep selloff.
Under Armour finally started to work on its issues in 2017, and investors responded accordingly. That is, UAA stock began to rise again. A technical ceiling has taken shape in the meantime though, and while it’s a clear problem, it’s also a clear potential catalyst if it can be hurdled. And, the stock is catching a pretty healthy tailwind.
Click to Enlarge
- The technical ceiling in question is around $24.60, near where UAA has topped out several times since the middle of last year. That line is plotted in blue on both stock charts.
- Although it hasn’t been able to break above $24.60 yet, UAA has left behind a trail of higher lows. The most recent low was made by a push up and off the white 200-day moving average line, highlighted on the daily chart.
- The tide is bullish, but there’s a gap from last week that needs to be filled, and for Under Armour shares, volatility is the norm. Any breakout may not take shape straightaway.
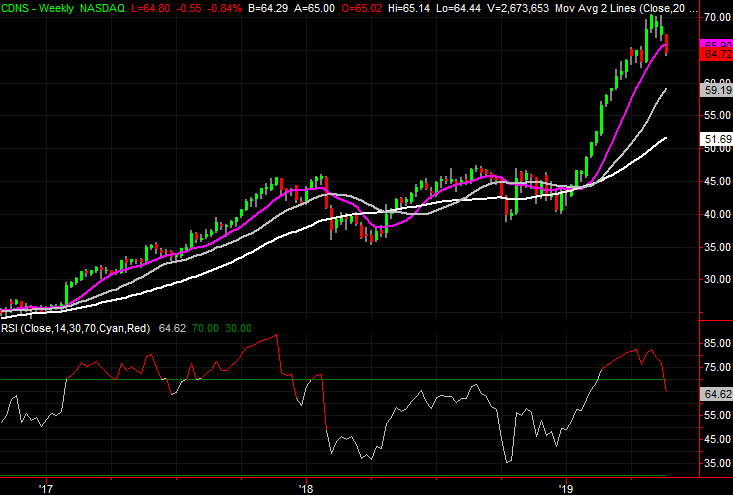
Cadence Design Systems (CDNS)
Monday’s tumble from Cadence Design Systems shares could have been chalked up as an effort to close the bullish gap left behind in April. Generally speaking, the market doesn’t like to leave gaps unfilled. That selloff was a good start to that effort, even if it didn’t actually touch that all-important April 22 low of $64.27.
The gap still hasn’t been filled either, as CDNS bounced a bit on Tuesday, and Wednesday’s lull wasn’t terribly devastating. The tendency to fill in gaps, however, may have done some other technical damage to Cadence Design Systems that will lead to more downside anyway.
Click to Enlarge
- The chief damage done is the move below the 50-day moving average line, plotted in purple on both stock charts. That line appears to be something of a technical ceiling now.
- Underscoring the way the tide has turned is the volume surges behind Monday’s and Wednesday’s selloffs.
- Zooming out to the weekly chart it’s easy to see just how overbought CDNS was as of last month, and how vulnerable it was and still is to profit-taking. Shares rallied 70% from their December low to their early May high.
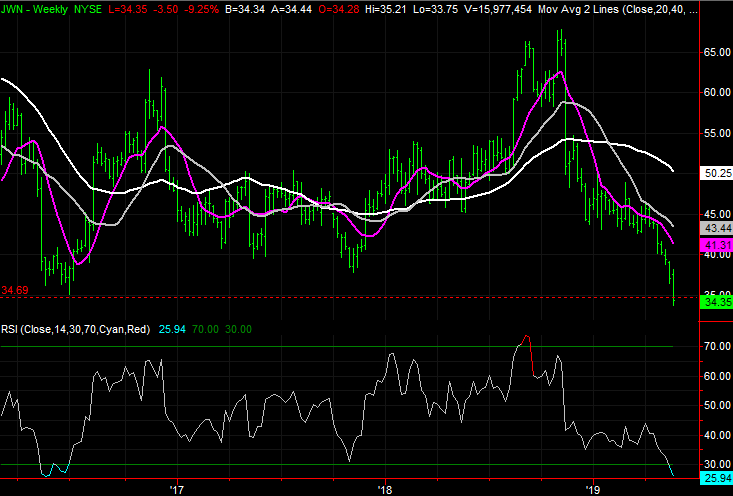
Nordstrom (JWN)
At first glance, Wednesday’s big stumble from Nordstrom would be alarming. It has been one of the bigger victims of the so-called retail apocalypse, and shares have been underperforming for years. A disappointing Q1 only underscores that worry.
Yet, a closer look at yesterday’s 9.2% setback — and the lead into it — suggests that sharp loss may actually be something of a capitulation that ultimately turns into a buying opportunity.
Click to Enlarge
- Wednesday’s bar was a doji, where the open and close are in the middle of the bar. This indicates that an equilibrium between the buyers and the sellers was met. The volume spike yesterday is also something often seen at key pivot points.
- On the weekly chart, we can see JWN hit a new multi-year low, falling under 2016’s low of just under $35. In many cases, traders are waiting to see prior lows met or exceeded before stepping back in.
- Also on the weekly chart, it’s clear that the RSI line doesn’t stay in an oversold state for very long.
As of this writing, James Brumley did not hold a position in any of the aforementioned securities. You can learn more about James at his site, jamesbrumley.com, or follow him on Twitter, at @jbrumley.