The market logged its fourth straight day of gains on Friday, fighting its way a little deeper into record-high territory for the last three. It all feels a bit artificial, but it’s not a train anybody dare risk jumping in front of.

Facebook (NASDAQ:FB) did more than its fair share of heavy lifting, up nearly 2% after the Federal Trade Commission settled its anti-privacy claim against the company for an affordable $5 billion. More importantly, the settlement puts the nagging matter in the past. Infosys (NYSE:INFY) logged the best gain for the day, however, up more than 6% in response to an impressive first quarter.
Weighing the market down more than any other name was Johnson & Johnson (NYSE:JNJ). Shares of the healthcare company fell 4% on new accusations that it knowingly lied about the cancer risks related to its talc products. It has prompted a criminal probe.
As the new week’s trading action gets going, however, its the stock charts of Netflix (NASDAQ:NFLX), Lowe’s (NYSE:LOW) and Edison International (NYSE:EIX
) that merit the closest looks. Here’s what’s most noteworthy about each.
Edison International (EIX)
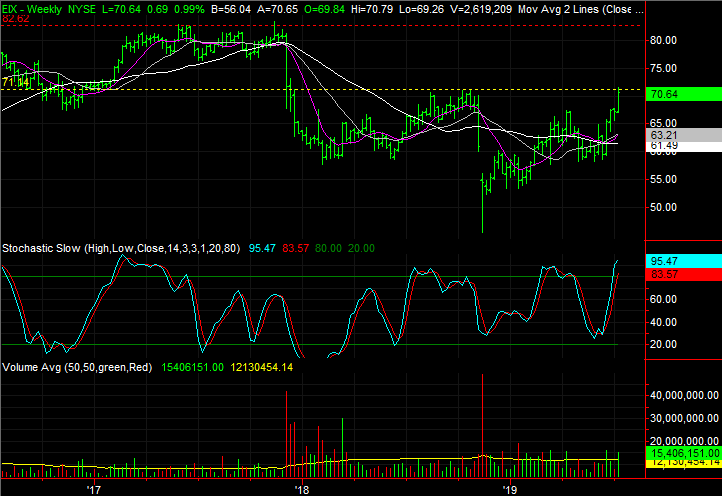
Like most other utility names, Edison International investors enjoyed a fruitful June. Unlike most utility stocks, however, EIX has continued to charge higher in July, avoiding the slowdown that has adversely impacted other names in the business.
Shares have finally hit a headwind at fairly well-established technical resistance. And, they’re now officially overbought. If traders can pull off a miracle and continue to march higher, however, there’s little left to hold the move back until much, much higher.
Click to Enlarge
- The ceiling in question is right around $71, marked in yellow on both stock charts. That’s where Edison peaked in October, and where it stopped advancing last week.
- Still, the volume behind the recent rally has been abnormally high. It has been induced by headlines related to last year’s wildfires in California, but there’s a horde of buyers amassing all the same.
- Should EIX manage to break out, there’s not another established technical ceiling in place until 2017’s highs near $82.
Lowe’s (LOW)
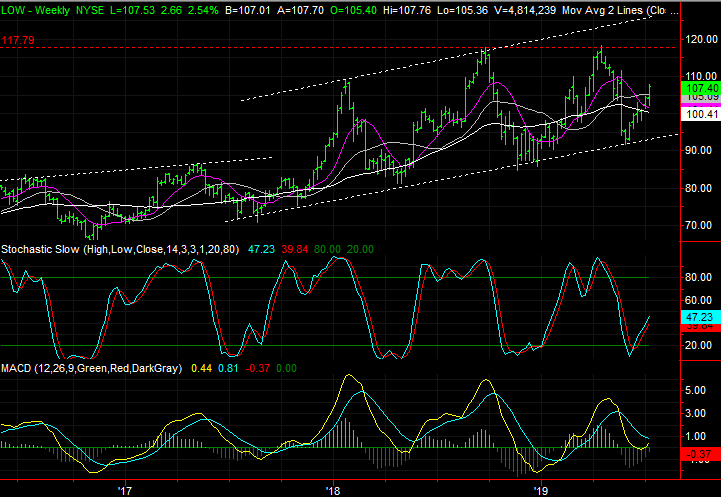
The recent rally from Lowe’s is a rather significant, given it has only been in place since late May. Shares are up 16% in just that eight-week stretch. There’s room and reason for LOW to continue moving higher, however. In fact, it’s more likely to do that — in spades — than not.
Click to Enlarge
- It’s apparent on the daily chart, though more so on the weekly chart, that the rebound was prompted by an encounter with a rising support line that extends back to 2017’s low.
- The same weekly chart also illustrates where the most likely upside targets are. There’s a horizontal ceiling near $118, marked in red, then there’s the upper boundary of the rising trading channel.
- Although the past couple of months have looked and felt overly bullish, the advance is still in its infancy. We don’t yet have a MACD crossover on the weekly chart, and we’re nowhere near close to being stochastically overbought.
Netflix (NFLX)
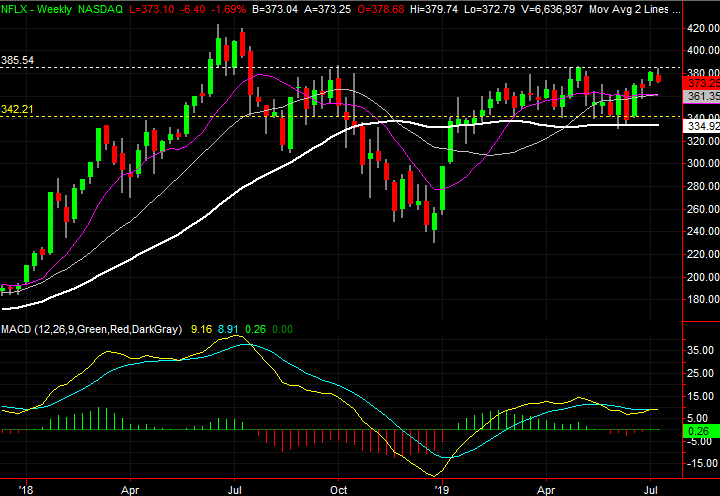
A month and a half ago, Netflix was on the verge of a serious meltdown. A horizontal floor was crumbling, and the 200-day moving average line (plotted in white on both stock charts) was under attack as support. And, both were happening right after NFLX bumped into a horizontal ceiling, plotted as a white dashed line on both stock charts.
The stock ended up evading disaster, pushing up and off the 200-day moving average line after all. But, last week, that technical ceiling once again came back into play. It not only capped the rebound effort, but appears to have rekindled the selling.
Click to Enlarge
- Friday’s 1.9% slide was not only a pullback on a day the overall market tide was bullish, it took shape on a suspiciously high level of volume — particularly for a Friday.
- The previous technical floors are still floors. That’s the horizontal floor at $342.20, plotted in yellow, and the 200-day moving average line currently at $338.17.
- The narrow trading range is well established. Having been in place for a while, any break outside of it could set up a prolonged move to make up for lost time as pent-up action is unleashed.
As of this writing, James Brumley did not hold a position in any of the aforementioned securities. You can learn more about James at his site, jamesbrumley.com, or follow him on Twitter, at @jbrumley.