It took a while to get going, but once the buyers stepped up on Wednesday, they didn’t look back. Once the S&P 500 was moving, its 0.47% gain carried it to a record-high close of 3,019.56.

Snap (NYSE:SNAP) led the charge with its 18.75% gain. The social media newcomer aced last quarter’s earnings and sales estimates, but more importantly, drove its best user growth since 2016. Sprint (NYSE:S) was a champ too though, rallying more than 8% during the regular session and gaining nearly 2% in after-hours trading in anticipation that its long-impending merger with T-Mobile (NASDAQ:TMUS) could be ultimately approved before the end of the week.
At the other end of the spectrum, shares of iRobot (NASDAQ:IRBT) plunged nearly 17% after issuing alarming guidance about its foreseeable future. Tariffs are getting in the way.
All of them have moved too explosively to handicap headed into Thursday’s session though. Rather, the stock charts of AT&T (NYSE:T), DISH Network
(NASDAQ:DISH) and Discovery (NASDAQ:DISCA) have emerged as the best bets.
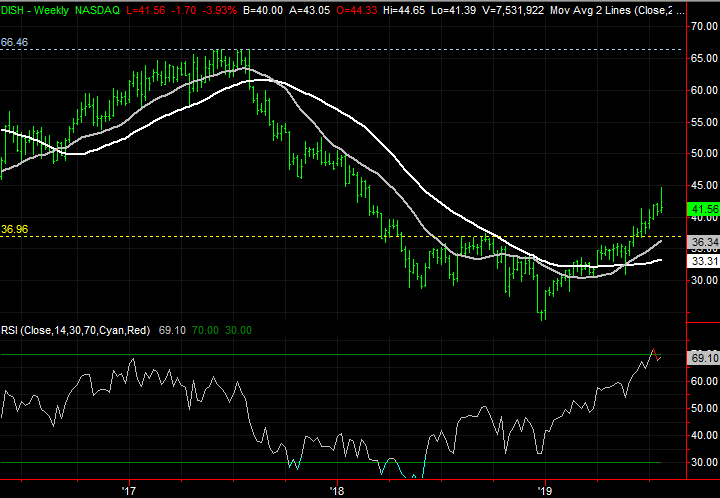
DISH Network (DISH)
The breakout move Dish Network shares mustered in late May and early June was the real deal, and still stands. DISH stock was pushed sharply lower in 2017 and 2018, and has a great deal of room to continue recovering.
That recovery isn’t likely to continue in a straight line though. In fact, the already overbought DISH stock moved into problematic territory early this week. Its new vulnerability has started to become a true problem with yesterday’s bar that took shape on word that it would be buying some of the assets forced to be sold in order for T-Mobile and Sprint to merge.
Click to Enlarge
AT&T (T)
AT&T has been recovering reasonably well from a 2017/2018 meltdown. In March, it firmly broke above a falling resistance line plotted in yellow on the weekly chart, and though erratic, has continued to make higher highs in the meantime.
That rebound was threatened last week and early this week by a strong wave of selling that materialized on even stronger volume. But, the action over the course of the prior three days confirms it’s still intact. In fact, it may be even stronger than initially presumed.

Click to Enlarge
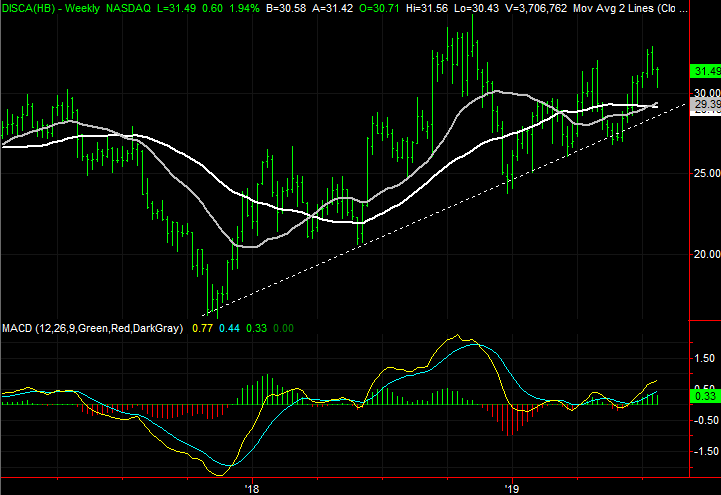
Discovery (DISCA)
Most stocks dance from time-to-time with their most important moving average lines, finding support and resistance there. In many cases, a cross of two moving average lines can serve as a major bullish or bearish clues.
Few stocks are as subject to the guidance of their moving average lines as Discovery is, however. And, given the context of this week’s trading action, investors would be wise to heed the clues, even if there’s room for a bit of volatility in the “wrong” direction.
Click to Enlarge
As of this writing, James Brumley did not hold a position in any of the aforementioned securities. You can learn more about James at his site, jamesbrumley.com, or follow him on Twitter, at @jbrumley.