Last week’s bullishness didn’t survive the weekend. The S&P 500 fell 0.48% on Monday, as the weight and scope of the gains since late May started to register with investors.
General Electric (NYSE:GE) took the biggest toll on the broad market, losing nearly 3% of its value, while Chesapeake Energy (NYSE:CHK) tumbled more than 2% to extend weakness that has pulled the stock closer to new multi-month lows.
At the other end of the spectrum, Overstock.com (NASDAQ:OSTK) jumped more than 13% after KeyBanc analyst Josh Beck said it was capable of competing with Amazon (NASDAQ:AMZN). He already rated OSTK at “Overweight,” but raised his target to $350 per share.
Headed into Tuesday’s trading, it’s the stock charts of Interpublic Group of Companies (NYSE:IPG), Eli Lilly (NYSE:LLY) and SYSCO Corporation (NYSE:
SYY) that merit the closest looks. This trio of names is knocking on the door of major moves.
Eli Lilly (LLY)
Eli Lilly has been sliding lower since peaking in March, breaking below the pivotal 200-day moving average line in early June. For a short while after that, it looked as if the bulls might have drawn a line in the sand. And, they may well have.
As of Monday’s close though, a that major line in the sand that’s acting as support is under some serious pressure. Worse, it’s being tested as a floor again after bumping into resistance at the one place it couldn’t afford to hit resistance.
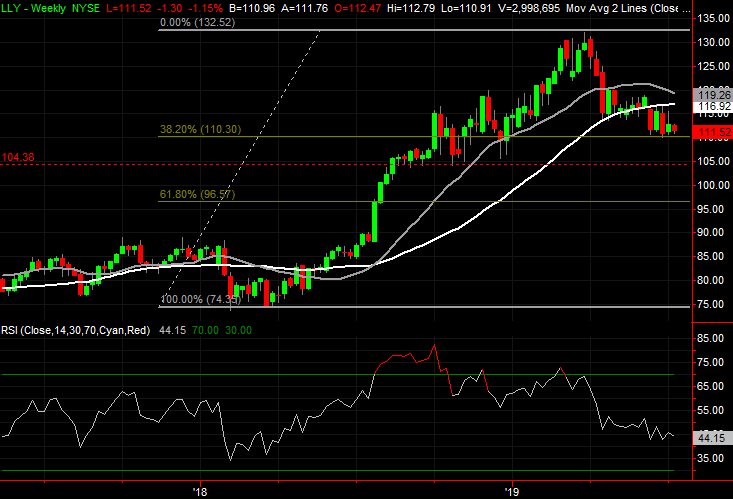
Click to Enlarge
- The ceiling in question is the 50-day moving average line, plotted in purple. Eli Lilly shares tried twice to crawl back above it since June (highlighted), failing both times.
- The recent support at $110.73, marked with a dashed yellow line on the daily chart is even more significant than it seems. As the weekly chart shows, that’s where the 38.2% Fibonacci retracement line lies.
- Should that floor fail to keep the stock propped up, there’s a minor floor just under $105, plotted with a red dashed line, though the next Fibonacci retracement line at $97 is also worth watching.
SYSCO Corporation (SYY)
Each and every stock has its own trading personality. That is to say, it exhibits tendencies in a way that no other name does. SYSCO is no exception to that norm. Its personality is one that uses, for better and worse, moving average lines as support and resistance levels. When it can cross one, a major move tends to take shape.
The interplay of SYY over the course of the past several weeks has set up a potential breakout thrust. But, right on cue — so far — SYSCO has once again bumped into resistance at a key line. If it can be broken, there’s a great deal of upside to traverse.

Click to Enlarge
- The line in question is the purple 50-day moving average, with the recent encounter highlighted along with other instances of support or resistance.
- Zooming out to the weekly chart we can see the rebound since late last year is an upswing within in even longer-term rising trading range that extends back to 2015.
- It’s modest thus far, but a glance back at the past several weeks shows more bullish volume than bearish volume, even if erratic.
Interpublic Group of Companies (IPG)
Interpublic Group of Companies shares haven’t made any net progress since late 2015. But, the past year and a half has been constructive … in a sense. The stock has been squeezed toward the tip of a converging wedge pattern, and though there’s a little more room left to move deeper into that point, the bulls are taking another shot at punching through the upper boundary of the wedge shape.

Click to Enlarge
- The wedge pattern is framed by blue lines on both stock charts. Monday’s close has left Interpublic Group shares right at the upper line.
- Also note on the weekly chart that even though the stock has only moved sideways (if not lower) for months, the rising accumulation-distribution line says there are more buyers than sellers.
- If the budding rally effort takes hold, there’s another ceiling just under $26, where IPG topped several times in 2017 and early 2018.
As of this writing, James Brumley did not hold a position in any of the aforementioned securities. You can learn more about him at his website jamesbrumley.com, or follow him on Twitter, at @jbrumley.