Overall, U.S. stock investors seem reasonably happy at the moment. The macroeconomic environment is solid, despite growth around 2% in the last two quarters. Hopes persist that the trade war with China will see a resolution. Geopolitical uncertainty appears minimal. As a result, those investors have been confidently buying equities, and broad market indices sit at all-time highs.

But there are pockets of uncertainty in this market. Growth names have looked a little shaky. The broad market rally hasn’t made its way to small retail names or energy stocks. And as Monday’s three big stock charts show, there are a few widely-held names in tech where investors can’t seem to make up their mind.
Admittedly, these big stock charts don’t necessarily provide much in the way of clarity on the individual names. But on the whole, they do show that there are names out there that can still join the rally, even in tech — though it’s likely that rally has to continue.
International Business Machines (IBM)
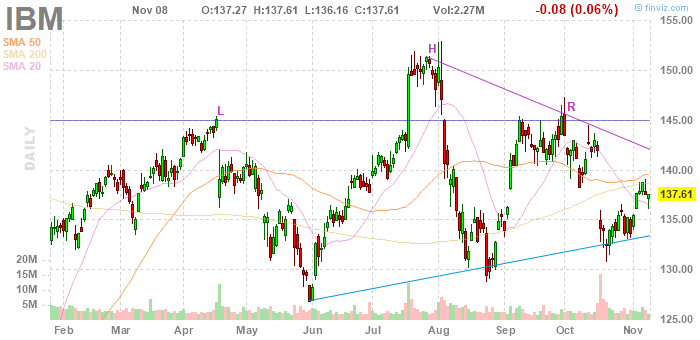
International Business Machines (NYSE:IBM) started the year off strongly, but it has been mostly sideways trading since the first month. And the first of our big stock charts suggests that might continue for some time:
- A classic and bearish head-and-shoulders pattern played out ahead of the company’s third quarter earnings report last month. IBM stock declined, as the chart suggested it would, with a Q3 revenue miss the catalyst.
- A brief rally from post-earnings lows has been interrupted, with longer-term moving averages providing resistance. IBM now is showing a sideways wedge formation, which signals a stock lacking direction. That formation usually suggests that IBM stock will accelerate in whichever direction IBM exits.
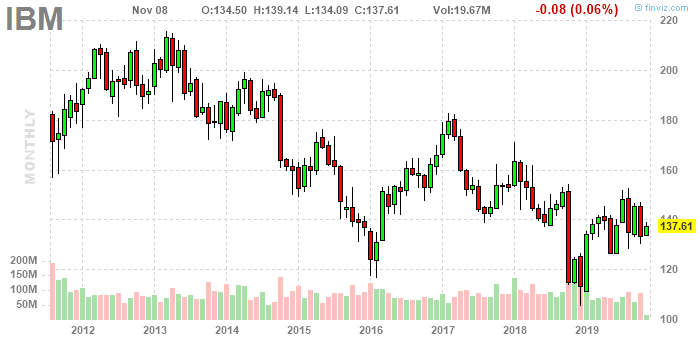
Click to EnlargeFundamentally, the trading since February makes some sense. The stock is in a bit of a holding pattern — and so are investors. IBM expects huge benefits from its acquisition of Red Hat, which obviously would be a positive for the stock. But the legacy business is struggling. It saw nearly six consecutive years of declining revenue, a trend that was broken in late 2017 but resumed last year. IBM stock does look cheap, but it has also moved in the wrong direction for most of this decade, and touched a post-financial crisis low in December.- The first of our big stock charts thus highlights an ambivalent market. The lesson from the chart makes sense in that context. Investors are in wait-and-see mode. But once the market makes up its mind, IBM stock seems likely to rally nicely, or potentially re-test December lows.
Oracle (ORCL)
It’s not terribly surprising that the first two big stock charts look somewhat similar. After all, Oracle (NYSE:ORCL) and IBM share some core attributes. Most notably, both are companies that established business models on-premise but are now trying to catch up with new competition. Both Oracle and IBM, of course, are trying to gain share in the cloud services business currently dominated by Amazon (NASDAQ:AMZN
), Microsoft (NASDAQ:MSFT), and Alphabet (NASDAQ:GOOG,NASDAQ:GOOGL).
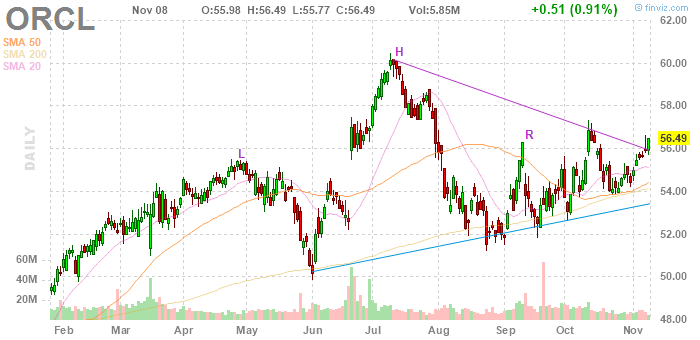
But from both a near-term and long-term standpoint, the ORCL chart looks much preferable to that of IBM. The question at the moment might be whether that will hold:
- Like IBM stock, ORCL stock followed a head-and-shoulders pattern into a sideways wedge. But ORCL didn’t see the same weakness in September that IBM did last month. And it has exited the top of the wedge, if narrowly so. With moving averages clearly holding as support (as opposed to resistance for IBM), the chart does suggest further strength, and perhaps even a breakout.
Click to EnlargeMeanwhile, from a longer-term perspective, Oracle stock still looks solid. The uptrend hasn’t necessarily been consistent, but Oracle has found a way to drive shareholder value over time. ORCL stock has doubled from 2012 lows while providing a dividend along the way.- Despite the gentle grind higher, Oracle stock isn’t out of the woods. Volume of late has been muted, which undercuts the bullish move out of the wedge. Fiscal Q1 earnings in September disappointed relative to Street estimates, and the Q2 report arrives in about a month.
- Oracle’s top-line trend isn’t quite as negative as that of IBM, but it posted four quarters of declining sales in fiscal 2019. Technicals look positive, but even at 13.4x forward earnings the fundamentals don’t seem nearly as bullish.

Square (SQ)
It seems like Square (NYSE:SQ) had an opportunity last week and didn’t take advantage. That seems true both fundamentally and in looking at the last of Monday’s big stock charts:
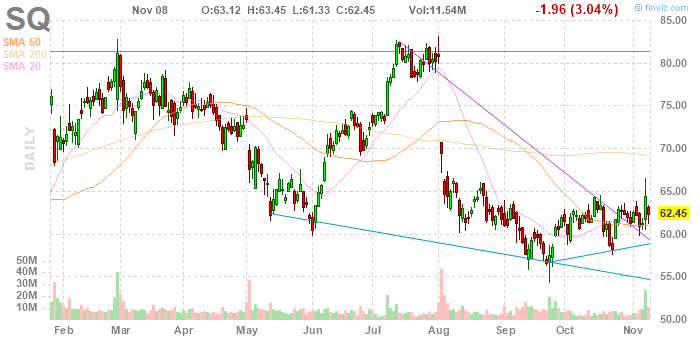
- Square stock was in excellent shape ahead of last week’s third quarter earnings report. Flat trading amid declines at high-flyers like Shopify (NYSE:SHOP), Roku (NASDAQ:ROKU) and many of this year’s initial public offerings suggested that investors were willing to stick with SQ stock despite a still-high valuation. That set up the Q3 release as a potential catalyst for bringing in new buyers and sending shares higher.
- Technically, the same was true. SQ stock had made a bullish reversal out of a declining narrowing wedge. Shares cleared the 20- and 50-day moving averages. There was a modest uptrend from September lows. Square stock was moving in the right direction.
- On both fronts, at the moment it looks like earnings weren’t good enough. SQ stock did trade as much as 8.6% higher on Thursday, the day following the after-hours release. But it closed up just 5%, and a 3% decline on Friday erased most of those gains. Square stock actually declined (if by 0.24%) for the week. SQ stock now is hugging moving averages, and the technical path to a rebound looks far less clear.
- Fundamentally, too, Q3 doesn’t look like quite enough. I wrote after the report that a one-day rally was all SQ would get, and at least in the early going the market seems to agree. A muted outlook for 2020 offsets some of the optimism from the performance of Square’s Cash App. And with Square stock still expensive in a market that appears to be questioning valuations again, a decent quarter just isn’t good enough. SQ has been rangebound since early August, and it appears likely to stay that way until at least 2020.
As of this writing, Vince Martin has no positions in any securities mentioned.