U.S. stocks head into this week at all-time highs — and on a hot streak. The Dow Jones Industrial Average, thanks in large part to Apple (NASDAQ:AAPL), posted its fourth consecutive weekly gain last week. The S&P 500 closed green for the sixth straight week.

The stock market remains strong, and so does the U.S. economy, even if gross domestic product growth has slowed in recent quarters. The American consumer is driving that growth, given increasing evidence of an industrial recession.
So what does an investor make of consumer stocks that are lagging that market growth? There are two possible perspectives. The first is to assume that the laggards will eventually catch up to the rest of the market, as long as the consumer cooperates. Conversely, investors rightly could wonder whether those stocks are fundamentally flawed. After all, if a stock falls in this environment, with broad indices continually marching to all-time highs and consumer pocketbooks open, that stock may do even more poorly when the cycle inevitably turns.
Monday’s big stock charts focus on three names for whom that discussion is paramount at the moment. All three have struggled to some degree of late. All three have hopes of rebounding, but these big stock charts suggest those hopes may wind up being dashed.
Yum! Brands (YUM)
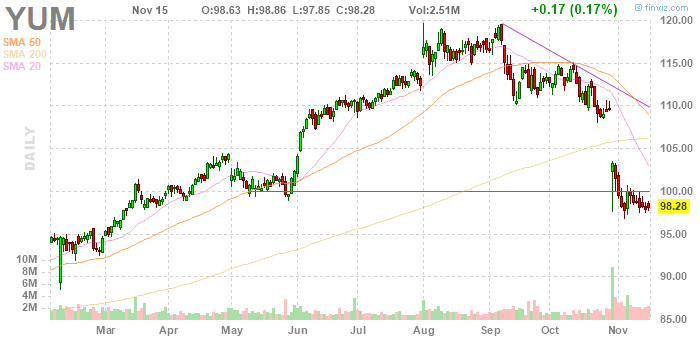
A surprising aspect of the recent market-wide rally has been that restaurant stocks like Yum! Brands (NYSE:YUM) have been declining. That’s unusual in a market moving higher at least in part due to receding fears of a recession.
The pullback in the sector does seem to provide some opportunities — but both fundamental concerns and the first of Monday’s big stock charts suggest YUM stock might not be one of them:
- The chart implies that demand for YUM stock could continue to weaken. Shares dipped below two key moving averages in September, which then provided resistance as shares continued to slide. A post-earnings sell-off late last month busted through the 200-day moving average. And now $100, which acted as support in the spring, at least in the near-term has turned to resistance. There’s little in the chart that points to near-term bullishness.
- There’s a fundamental issue as well. Again, restaurant stocks have sold off. Both quick-service giant McDonald’s (NYSE:MCD) and casual dining leader Darden Restaurants (NYSE:DRI) are down over 12% from September highs. Weaker-than-expected earnings reports for both companies have contributed, but those stocks started slipping around the same time as YUM stock. So did Starbucks (NASDAQ:SBUX), which has declined a similar amount from early September levels. Whether the group simply had run too far, or investors see reason for concern going forward, pretty much the entire sector is cheaper than it was two-and-a-half months ago.
- Even in that context, it’s tough to make the case for Yum! Brands here, even with a larger decline. YUM’s Q3 whiff was bigger, and more concerning, than relatively modest misses by McDonald’s or Darden. The Pizza Hut unit continues to struggle with same-restaurant sales, and may should continue to do so as more restaurants offer third-party delivery services. And at 23x forward earnings — a premium to McDonald’s stock — Yum! Brands hardly is cheap. There are potential buying opportunities in the sector, but at the moment YUM stock doesn’t look like one of them.
Tapestry (TPR)
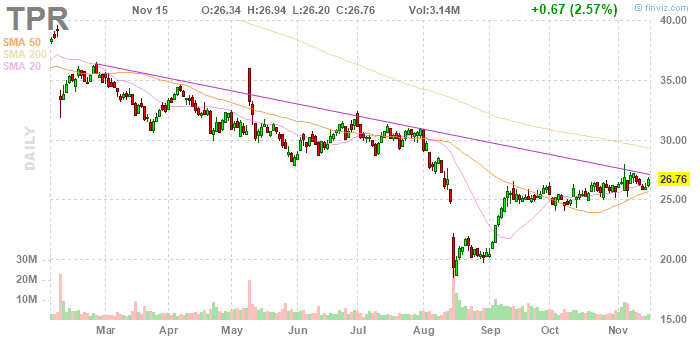
The second of Monday’s big stock charts, Tapestry
(NYSE:TPR), looks more positive. Shares of the handbag manufacturer, known as Coach before it acquired Kate Spade in 2017, has rallied 44% from August lows, rewarding investors who bought the dip after a disappointing fiscal fourth-quarter report.
Technically, there is a case for a continued rally, particularly after a better-received Q1 release earlier this month. But there are reasons for caution as well:
- TPR certainly can break out, particularly if broad markets continue to rally. 20- and 50-day moving averages have provided support for some six weeks now. If Tapestry stock can clear the declining trend line, the next test would be the 200-day moving average. A move through that moving average would leave room for a nice move higher.
- Fundamentally, that technical case doesn’t seem outlandish. TPR stock has gained 40%-plus, but still trades at less than 11x fiscal 2020 earnings per share estimates. And it’s worth noting that the average Wall Street price target currently sits just above $30. A move through the 200 DMA to near that level might cause analysts to revise their targets higher, adding fundamental fuel to the technical rally.
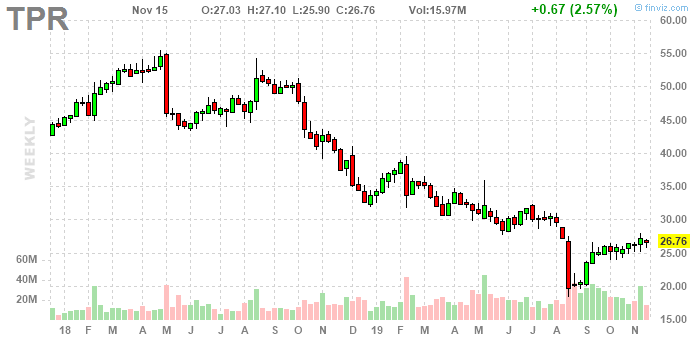
Click to EnlargeThat said, there’s also a risk that the near-term bearish pattern of lower highs will persist, with the downward trend line again acting as resistance. Taking a broader view, TPR’s weekly chart looks much more bearish than its daily chart. The bounce off August levels appears impressive — but those prices below $20 represented a ten-year low for TPR stock. In the context of the weekly chart, recent gains look more like a “dead cat bounce” than a true reversal, at least so far.- Fundamentally, there are risks as well. TPR stock is cheap — but there’s a case it should be. The company is guiding for flat EPS year-over-year for fiscal 2020 — hardly inspiring at this point in the economic cycle. Capri Holdings (NYSE:CPRI), owner of the Michael Kors brand, is far cheaper at barely 7x this year’s earnings. The 5% dividend yield offered by TPR stock is attractive, and may have helped support the stock after the August sell-off. But that alone may not be enough to spark a sustainable rally.
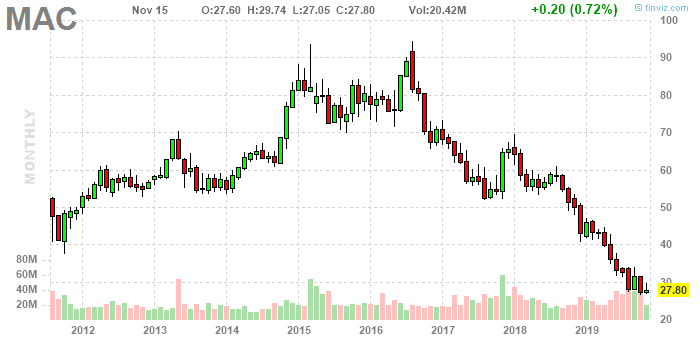
Macerich (MAC)
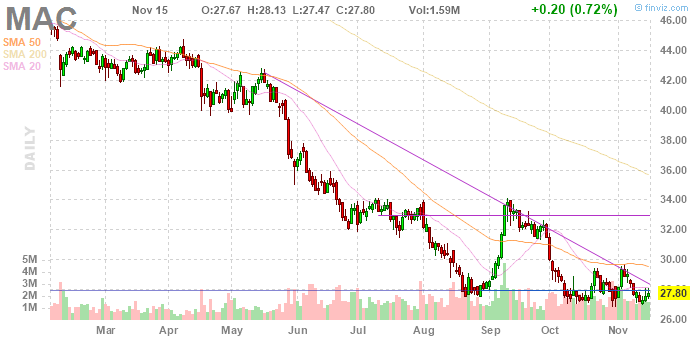
Mall real estate investment trust Macerich (NYSE:MAC) seems compelling at these levels. MAC stock yields an almost unheard-of 10.8%. Funds from operations (FFO, a common adjusted profit measure used by REITs) is guided to $3.50-$3.58 this year, suggesting a price to FFO multiple under 8x.
And while mall weakness is no surprise, Macerich isn’t necessarily exposed to the worst of traffic weakness in brick-and-mortar retail. Its properties are much higher-end than those of Washington Prime (NYSE:WPG) or CBL & Associates (NYSE:CBL). A new 50%-owned development in downtown Philadelphia opened in September, and should help earnings in 2020. Macerich’s high sales per square foot figures suggests its tenants are among the stronger retailers out there.
But there are real concerns here fundamentally, and as the last of Monday’s big stock charts shows, technically:
- The near-term chart is a classic descending triangle: a bearish formation that is a combination of stagnant support and declining highs. It’s a formation that quite often leads to support finally giving way.
Click to EnlargeThat outlook might seem overly pessimistic, or even impossible, given the double-digit yield and the single-digit P/FFO multiple. But MAC stock has looked cheap for some time now, and the yield has only risen. Ever since Macerich rejected a bid of $95.50 from Simon Property Group (NYSE:SPG) in 2015, MAC stock has done nothing but fall. The monthly chart shows an obvious ‘falling knife,’ and a stock that has been a danger to every investor who tried to catch it.- Meanwhile, there are fundamental reasons for the weakness. Most notably, FFO has declined in recent years. It’s tempting to assume that investors are mistakenly selling MAC stock because they don’t realize its higher-end status. But that status hasn’t protected its shareholders yet, with the stock down 70% in a little over three years. As the chart shows, it wouldn’t be stunning if those declines continued.
As of this writing, Vince Martin has no positions in any securities mentioned.