Investors started the new trading week in the same lethargic mood they left the old one … not bearish so much as disinterested until they have more clarity. The S&P 500’s close of 2,858.61 was 0.53% lower than Friday’s close, leaving the market as much within reach of a renewed rally as it is on the verge of a correction. Total volume behind the pullback relatively light.
Utility company PG&E (NYSE:PCG) led the way, losing a stunning 52% of its value after the organization announced it would be filing for chapter 11 bankruptcy. The company, which faces an enormous liability for its role in California’s recent wildfires, recognizes it won’t be able to handle that burden otherwise.
Beyond that, however, the picture wasn’t quite so grim. Citigroup (NYSE:C) jumped nearly 4% in response to a so-so fourth quarter report, while Goldcorp (NYSE:GG) gained more than 7% on Monday. The mega-bank anticipates impressive revenue growth this year, while the gold miner is to be bought by rival Newmont Mining (NYSE:NEM). Newmont shares subsequently fell nearly 9%, as the deal will be a dilutive all-stock deal that arguably overvalues Goldcorp at $10 billion.
The best prospects for today’s action, however, are names that are much less volatile. The stock charts of Facebook (NASDAQ:FB), Merck (NYSE:MRK) and Broadcom (NASDAQ:
AVGO) have been quietly moving into grooves that have largely been overlooked, leaving each on the cusp of trade-worthy moves.
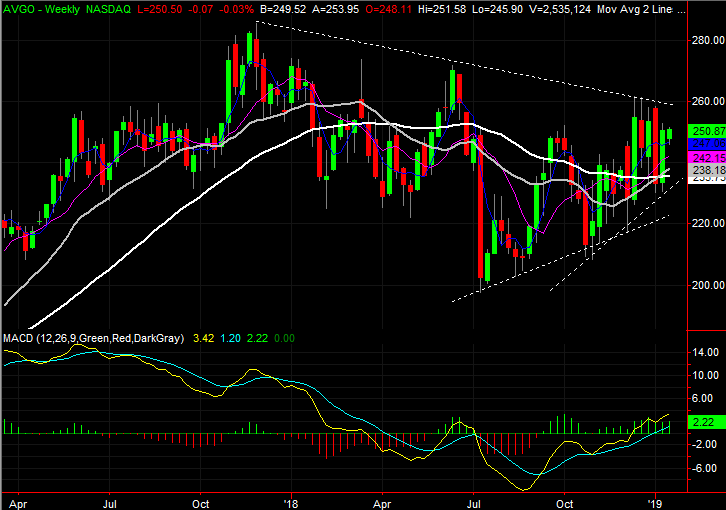
Broadcom (AVGO)
Back on Dec. 28, we pointed out Broadcom shares were in rally mode, and testing a key technical ceiling. That ceiling was closer to being tested the next two. That look is marked in the daily chart with a yellow arrow. Three days later, AVGO shares were in a freefall, calling the whole idea into question.
The stock is back in rally mode though, and the next test of that very same technical ceiling is even better founded effort than the previous one was. The bulls are getting closer to that breakout move.
Click to Enlarge
• Though shares of Broadcom were hammered on Jan. 3, all the key moving average lines have stepped up as support levels. Better yet, the purple 50-day moving average line just crossed above the white 200-day moving average line … a so-called “Golden Cross.”
• The upper boundary of the narrowing trading range is at $259.
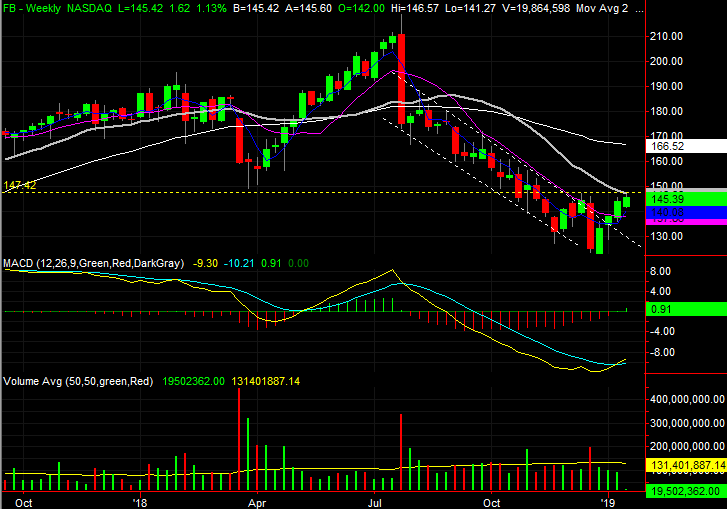
Facebook (FB)
A little over a month ago, Facebook was in trouble. Between the threat of regulation and the reality of a customer revolt, the sellers inadvertently framed a falling trading ranges that chopped the value of the stock by more than a third.
Shares broke out of that downtrend in December, though, and while it took an even lower low and then another bullish effort to finalize the bottom, that’s happened too. Now there’s just one more hurdle to clear if FB stock is going to start moving higher again.
Click to Enlarge
• In the meantime, the purple 50-day moving average line has been hurdled after it was a technical ceiling a month ago.
• On the weekly chart of Facebook we’re already in the shadow of a bullish MACD crossover … the first time it has been bullish since the middle of last year.
Merck (MRK)
Finally, had rival Pfizer (NYSE:PFE) and other pharma names not further defined similar moves, the pattern Merck has left behind of late wouldn’t be remarkable.
Given the clues at hand, however, investors can’t afford to ignore the brewing risk. Merck and its peers have been unusually bullish since early last year, and that leaves them especially vulnerable right now. One more misstep could pull the rug out from underneath the group, and from MRK in particular.

Click to Enlarge
• There is something different going on right now, however, that we’ve not seen in a while. That’s strong selling volume. Two of the past three days have been high-volume selloffs, suggesting there are sellers waiting in the wings.
• On the weekly chart, we’ve already logged a bearish MACD cross that technically killed last year’s incredible uptrend.
As of this writing, James Brumley did not hold a position in any of the aforementioned securities. You can follow him on Twitter, at @jbrumley.