The first trading day back from the weekend wasn’t exactly an encouraging one. With a triple-witching in the rear view mirror, the S&P 500 fell 0.17%. That still leaves it above all key moving average lines, though clearly backing away from record highs.

Bristol-Myers Squibb (NYSE:BMY) did more damage than any other name, falling 7.5% following news that it must sell blockbuster psoriasis drug Otezla before its intended merger with Celgene (NASDAQ:CELG) can be consummated. Celgene shares fell more than 5% on the news too, as the devaluation of the combined company may pose a threat to the deal.
There were a handful of winners. Most notable among the gainers was Caesars Entertainment (NASDAQ:CZR), up more than 14% on the heels of news that Eldorado Resorts (NASDAQ:ERI) would be acquiring the drama-laden rival for $17.3 billion. Eldorado shares, conversely, fell more than 10%. Some investors feel Eldorado is paying too much.
None of those names are great trading prospects headed into Tuesday’s session, however. Rather, take a look at stock charts of Electronic Arts (NASDAQ:EA), Advance Auto Parts (NYSE:AAP) and MGM Resorts
(NYSE:MGM) for your top possibilities.
MGM Resorts (MGM)
It’s not over a final hump just yet, but it’s getting close. In fact, one more good day from MGM Resorts could solidify several weeks’ worth of work, and kick-start an overdue rally effort. Better still, that move would trigger another bullish signal, bolstering the breakout thrust in its earliest stages.
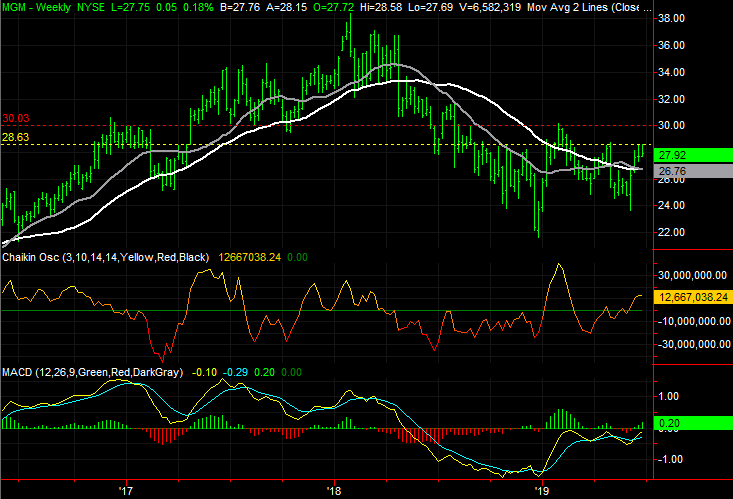
Click to Enlarge
- The line in the sand is $28.40, plotted with a yellow dashed line on both stock charts. That’s where MGM has topped several times in recent weeks, including last week.
- It has not happened yet, but the purple 50-day moving average line is about to move above the white 200-day moving average, resulting in a ‘golden cross’ that often flags more bullishness.
- Although not as critical as the horizontal ceiling at $28.40, the weekly chart does suggest there could be turbulence right around the $30 mark.
Advance Auto Parts (AAP)
When we last looked at Advance Auto Parts back on June 4, it was near trouble, but not in trouble just yet. Namely, a technical floor around $151.40 was still intact, but being heavily pressured. One more rough day could push it over the edge.
That never happened. Rather, AAP shares once again pushed up and off of that floor. That effort was incredibly short-lived though, quelled by an encounter with a (very) well established resistance line. Now Advance Auto Parts is back to its breaking point, and in worse shape than it was earlier this month.
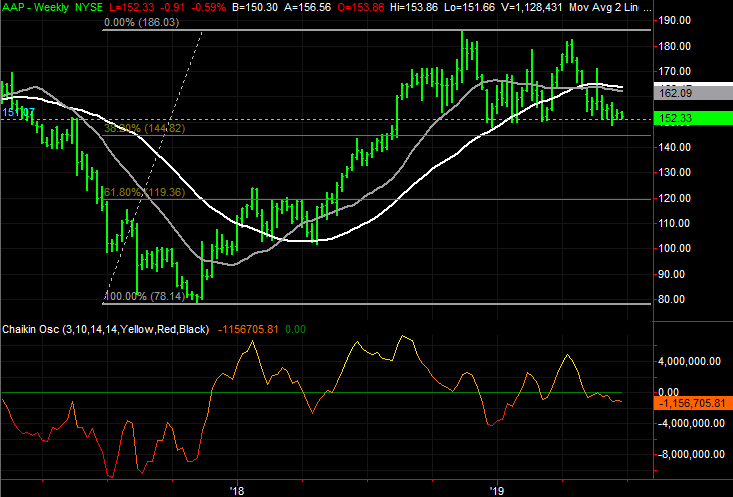
Click to Enlarge
- The 20-day moving average line, marked in dark blue, has once again stepped up as a technical ceiling, ending the rebound effort in early June and again last week.
- In the meantime, the purple 50-day moving average line has crossed below the 200-day moving average line, resulting in a ‘death cross’ that sets the stage for more downside.
- With no other previous floors or ceiling in view since late-2017, the Fibonacci retracement lines near $144.80 and then $119.40 become the next most likely landing spots should the selloff take shape.
Electronic Arts (EA)
Although Electronic Arts shares got the new year started on a bullish foot, unwinding a rather rough end to 2018, that move petered out pretty quickly. EA stock has been mostly range-bound since the latter part of February. In fact, it has been getting squeezed into a narrowing trading range since early May.
That all changed on Monday though, for the better. And, the breakout move took shape with another major bullish clue backing it up. There’s little left to stand in the buyers’ way now.

Click to Enlarge
- The converging wedge in question is plotted by yellow lines on the daily chart. The “squeezing” means the new breakout is somewhat spring-loaded.
- With or without the move out of the narrowing trading channel though, the turnaround effort since April has been healthy. Rather than a V-shaped bounce, which don’t always follow through, we’ve seen a nice U-shaped, rounded reversal.
- The gains that have broken Electronic Arts shares out of the trading range over the course of the prior two trading days unfurled on above average volume. There may be more buyers waiting in the wings than are easily recognized.
As of this writing, James Brumley did not hold a position in any of the aforementioned securities. You can learn more about him at his website jamesbrumley.com, or follow him on Twitter, at @jbrumley.