Another volatile day on Wall Street has pushed around the stock market. After months of slow and steady gains, the recent action isn’t very welcomed by bulls. But it’s lined up another set of must-see stock charts.
Check out 0ur latest bit for how to trade the FANG names — Facebook (NASDAQ:FB), Amazon (NASDAQ:AMZN), Netflix (NASDAQ:NFLX) and Alphabet (NASDAQ:GOOGL, NASDAQ:GOOG). Trading the broader market and VIX can be found here. As with both, look to see how these stocks trade on rebounds to key areas and moving averages. If they are rejected, more trouble could lie ahead.
Must-See Stock Charts #1: Delta
Click to Enlarge
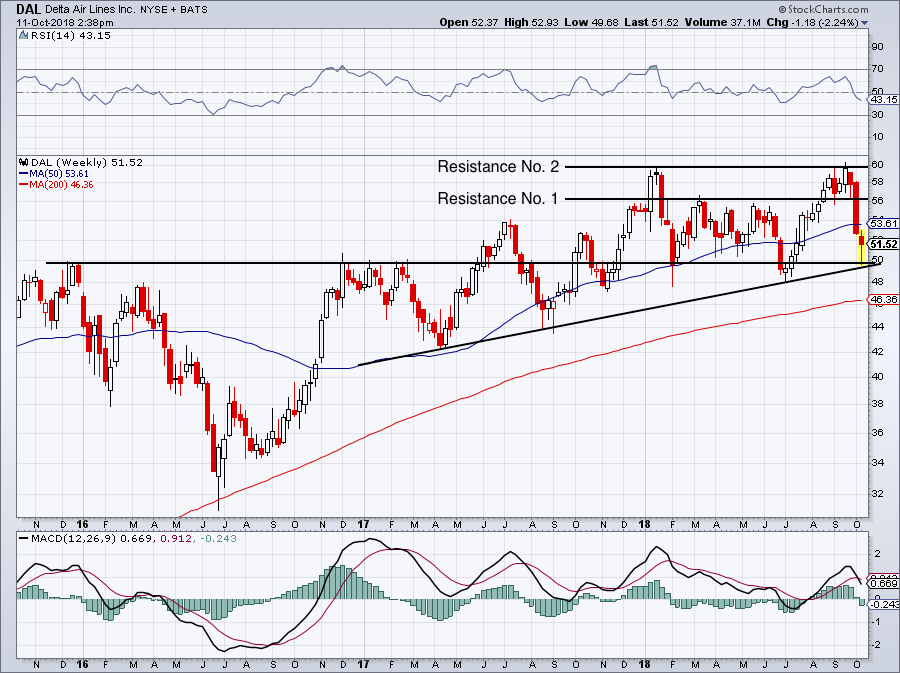
Amid the carnage, Delta Air Lines (NYSE:DAL) has risen about 2.75% as of now. The company’s better-than-expected earnings results were enough to buoy the stock amid a tough round of selling.
The trade is pretty simple now. After $56 refused to act as support despite acting as prior resistance, Delta now needs to hold the bottom of its prior long-term range. In that case, that’s $50. Below $50 and traders may want to step to the sidelines.
Must-See Stock Charts #2: Walgreens
Click to Enlarge
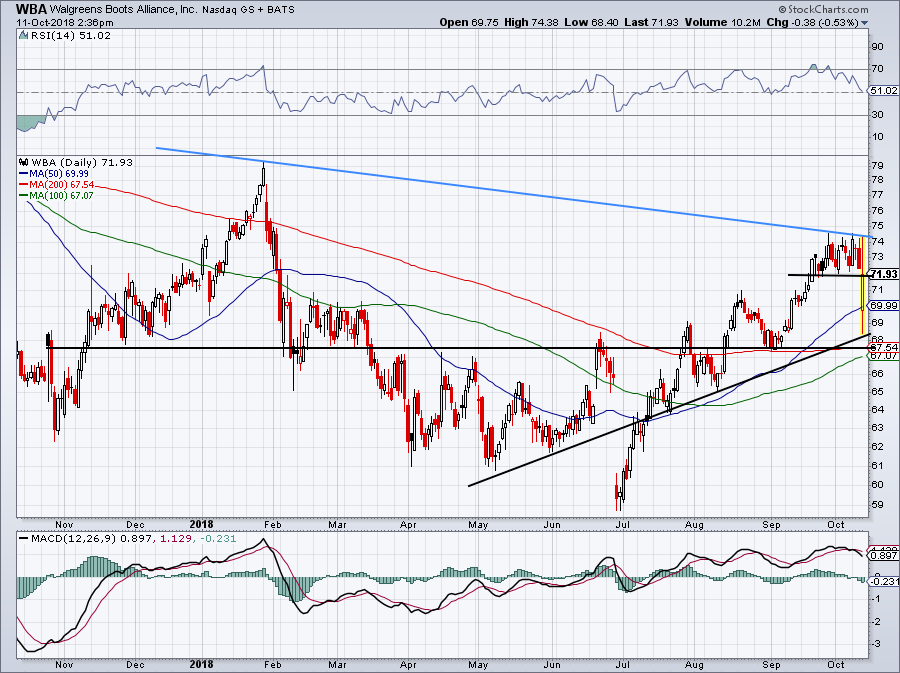
Like, DAL, Walgreens (NYSE:WBA) also
reported earnings Thursday. However, shares are down a little more than 1% following the results.
If investors are already long WBA, they have to be encouraged with today’s rally off the lows in the face of a volatile stock market. For those looking for a new position in the name though, let’s wait.
While Thursday’s action was good, I want to wait on buying WBA unless it can push above downtrend resistance (blue line). It’s encouraging back above this $72-ish area and still above all three major moving averages. Under normal circumstance, it would be easier to make a case for WBA, but not in the current environment.
Must-See Stock Charts #3: Square
Click to Enlarge
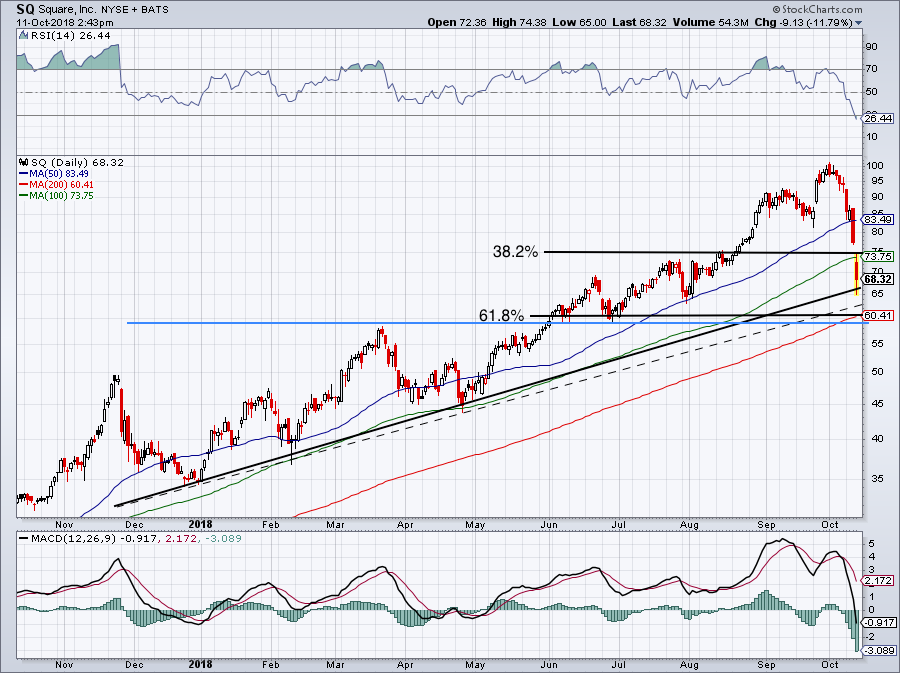
What’s worse than announcing your CFO is departing (even if they’re to become a CEO somewhere else) and having your stock fall 11% as a result? Doing it on a day where your stock already fell 10% the day prior. Back-to-back double-digit drawdowns in Square (NYSE:SQ) have hammered the stock. Shares bottomed out near $65, for now anyway, after having ticked above $100 just earlier this month.
Both the 50-day and 100-day moving averages failed as support and the 38.2% Fibonacci retracement didn’t do much good either. For those that have watched SQ run for months and months though, maybe it’s worth a shot near $60.
That’s where a few key prominent short sellers were targeting on their decline, so it could be a good place for them to buy-to-cover. Further, it marks the 200-day moving average and the more-critical Fib retracement mark of 61.8%. Depending on how you draw your trend-lines, some traders may find support there too. At the very least, $60-ish would represent a solid risk/reward in Square.
Must-See Stock Charts #4: Canopy Growth Corp
Click to Enlarge
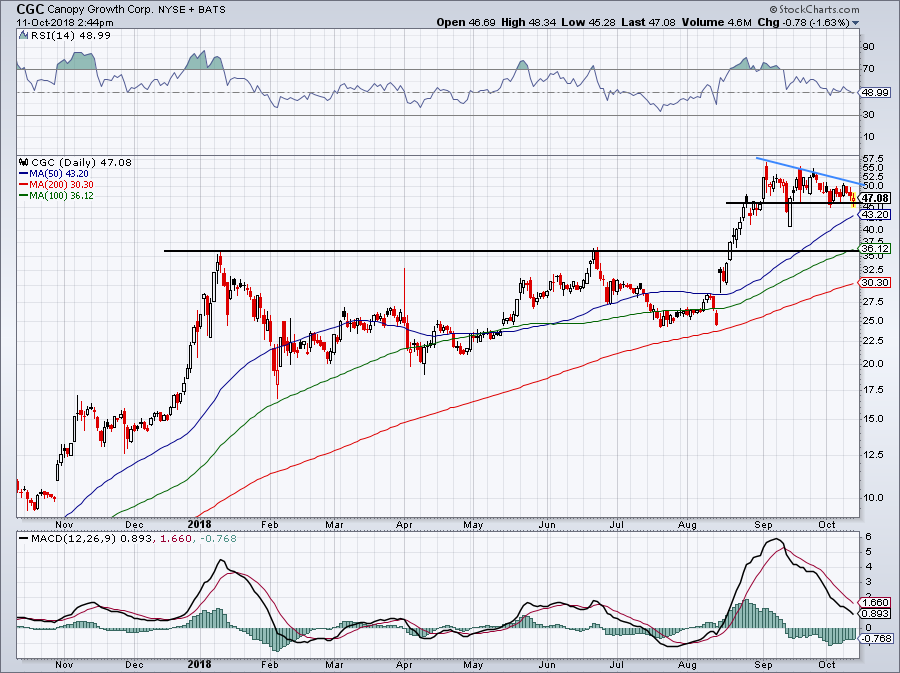
If I told you one of the better performing stocks amid an 8% pullback for the Nasdaq in five days would be Canopy Growth (NASDAQ:CGC), would you believe me? I wouldn’t have, but that’s exactly what we have.
This pot stock continues to…never mind. I can’t make another crappy pot pun. But either way, it’s holding in pretty good.
Because the risks are too high for me, I won’t buy CGC right now. But when the market starts to settle down, this may be one to take a look at on the long side. I don’t love that CGC has a downtrend line above it, but all things considered, it could be worse.
I’d really like it on a pullback to about $36, though. Let’s see how it does on Friday and early next week.
Must-See Stock Charts #5: Gold Miners ETF
Click to Enlarge
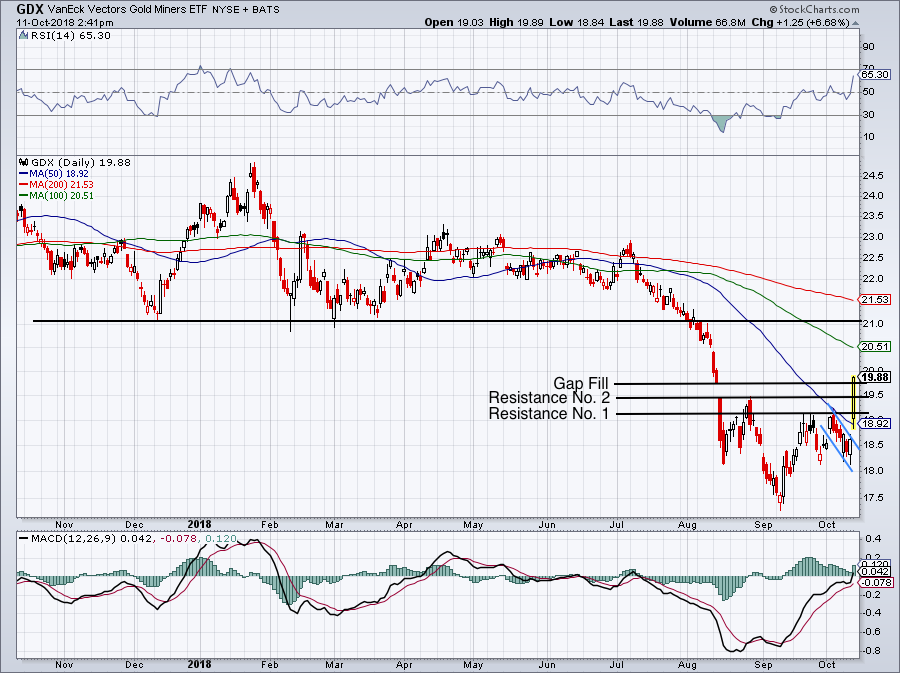
The VanEck Vectors Gold Miners ETF (NYSE:GDX) really took off this morning.
The ETF is up more than 6% on the day and if the stock market continues to selloff, investors will look for safe haven assets like gold to rally. Today’s move pushed GDX over two resistance marks, a gap fill at $19.75 and over the 50-day moving average. It also took it out of a downward channel.
Now near $20, what should investors do?
See if this gap fill area holds a support. I know that’s a very nearby level, but I don’t want to chase something that’s up 6% knowing full well that it could be down 6% tomorrow. Other levels could turn to support, such as the ones GDX hurdled today, but I don’t want be the one hoping they do.
If support does come into play, $21 is a reasonable target, provided GDX can get through the 100-day. If you didn’t catch the move, wait. Like everything else right now, chasing late could cause problems.
Bret Kenwell is the manager and author of Future Blue Chips and is on Twitter @BretKenwell. As of this writing, Bret Kenwell is long GOOGL.