
After a rocky end to last week, investors are quickly learning to endure a rocky start to this one. High-yield stocks, REITs and surprisingly enough, General Electric (NYSE:GE) all continue to do well. So too does Starbucks (NASDAQ:SBUX). But for everything else, the selling pressure remains a concern. Like SBUX and GE in the recent past, let’s look at our top stock trades to see if we can find out what’s going on.
Top Stock Trades for Tomorrow: Alphabet (GOOG, GOOGL)
Click to Enlarge
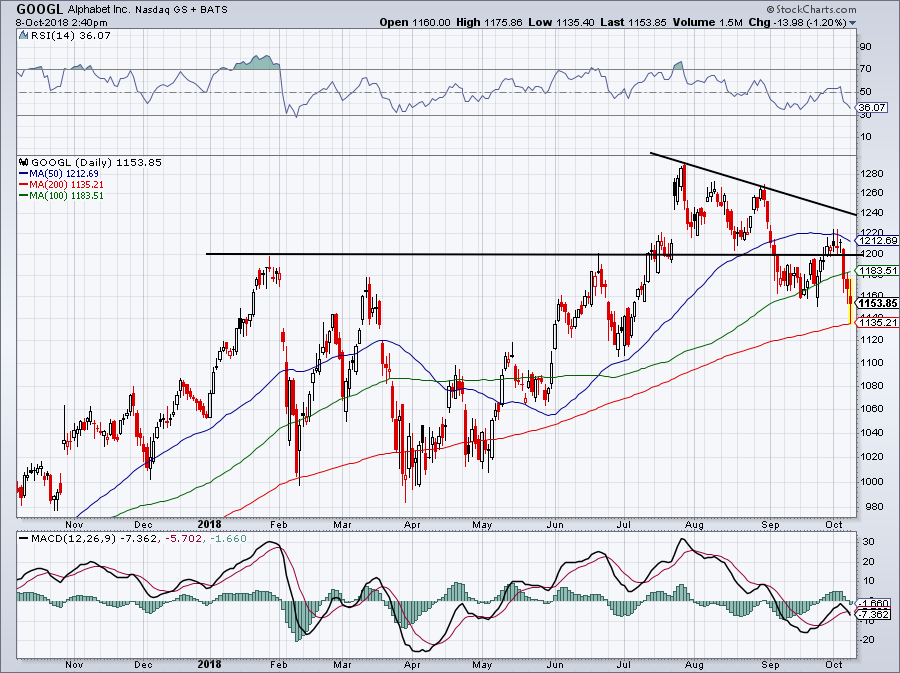
Shares of Alphabet (NASDAQ:GOOGL, NASDAQ:GOOG) took a quick beating on Monday, dumping down to the 200-day moving average. Thanks to a data breach impacting less than a million users, the company will shutter its Google+ platform.
I don’t think many investors will miss that unit.
In any regard, the stock has become incredibly choppy with the recent Nasdaq correction and the stock’s inability to get above and stay above $1,200. I like GOOGL on its 200-day tag and short-term traders can use a close below this mark — call it $1,110 as GOOGL tends to overshoot the 200-day — as their stop-loss.
I wouldn’t stick around if GOOGL can’t get through the 50-day, but on a close over $1,200, investors can add to their position.
Tesla (TSLA)
Click to Enlarge
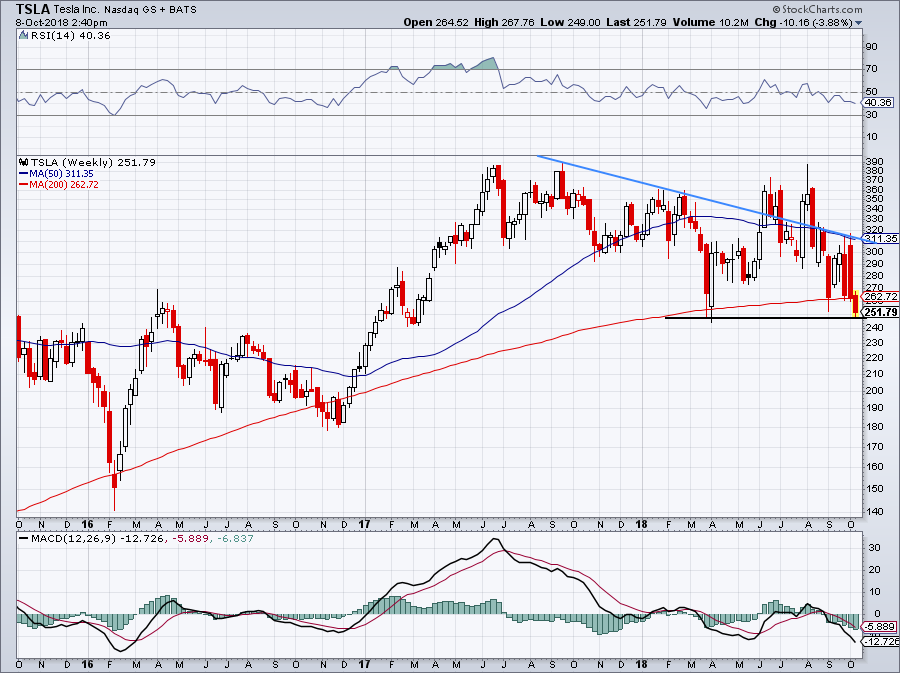
Down more than 5% at one point Monday, Tesla (NASDAQ:TSLA) stock hit $250. Shares are flirting with new 52-week lows, something it will do if it takes out the lows from April.
Above is a three-year weekly chart, and this week’s decisive move below the 200-week moving average is surely a concern. It’s only Monday, so there’s still a chance it can close above this mark. However, Tesla’s chart is beginning to look more and more bearish. New 52-week lows and a close below the 200-week would make this stock highly concerning.
A rally back to $300, above which was prior support, looks daunting too, with the 50-week moving average now trending lower and stiff downtrend resistance (blue line) both in play. Be careful with Tesla going forward.
JD (JD)
Click to Enlarge
JD.com (NASDAQ:
JD) is a name we’ve been watching for a long time, both on InvestorPlace and on Twitter.
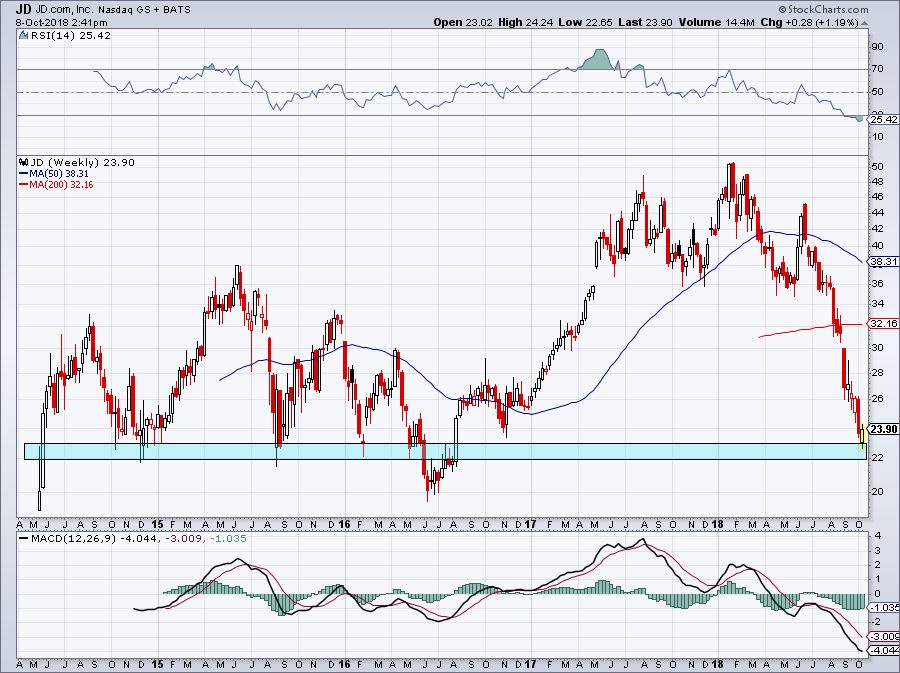
The stock has been hammered, falling more than 50% in just a few months. The valuation is pretty cheap, especially as we enter the holiday season and Single’s Day in November.
Specifically though, we’ve pointed out this $22 to $23 level a few times over the last few months. With a low of $22.65 today, traders had ample room to nab this before it turned green and got up to $24.
There’s now an excellent risk/reward in the stock. It’s somewhat akin to catching a falling knife, but at least there’s a measurable amount of risk at a level we’ve been watching for a long time. If Chinese equities get some mojo back, a significant rebound isn’t out of the question.
Square (SQ)
Click to Enlarge
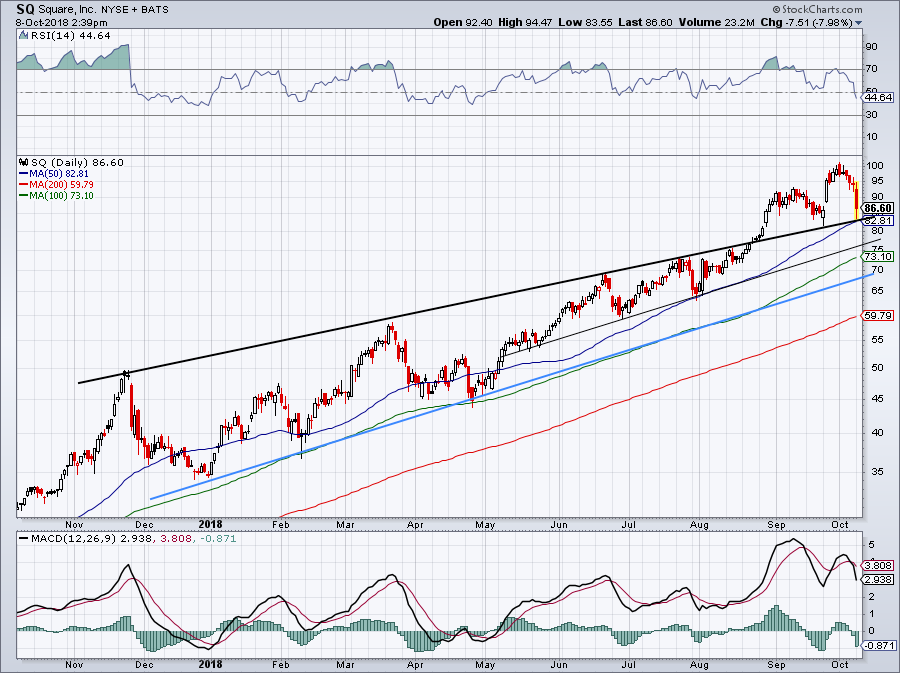
Shares of Square (NYSE:SQ) tumbled 10% in Monday’s session, bouncing off the 50-day and the backside of prior uptrend resistance. This was an excellent buying opportunity.
If only we had known about this level before. Oh wait…
Traders can use a close below these marks as their stop-loss. Below $82 and we’ll likely see the 100-day down near $73. Should that level fail as support and SQ moves below uptrend support (blue line), we have the 200-day down near $60.
Home Depot (HD)
Click to Enlarge
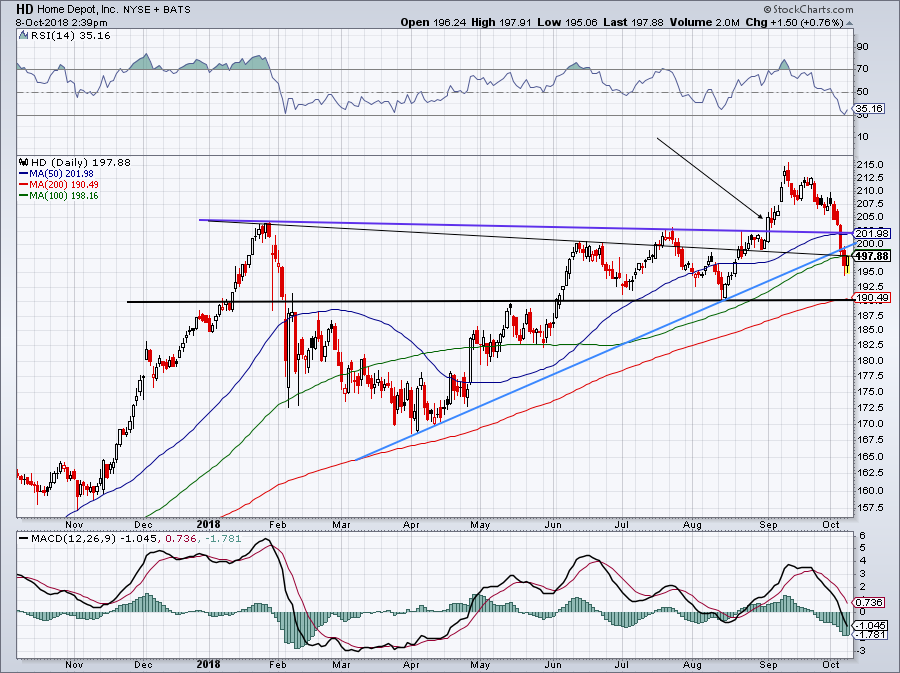
InvestorPlace readers were able to nail the breakout trade in Home Depot (NYSE:HD) in early September. Those gains sparked a quick run to $215, but since then it has been tough sledding.
I was hoping we’d get a decline down to $190, where HD would find prior level support and the 200-day moving average. Perhaps we will still get such a decline. For now, see how HD handles the 100-day and the backside of prior uptrend support at $200. It will take a few sessions to find out, but prior breakout resistance and the 50-day moving average are up just under $202.
So keep it simple. Either buy on a deep correction to $190 or on a close above $202. Remember, define your risk.
Bret Kenwell is the manager and author of Future Blue Chips and is on Twitter @BretKenwell. As of this writing, Bret Kenwell did not hold a position in any of the aforementioned securities.