Another seemingly decent day turned bearish again, thanks to the Federal Reserve. The FOMC opted to go ahead and impose a quarter-point rate-hike, but dialed back its 2019 plans (subject to change) to only two more interest rate increases. Unsure if a slightly more dovish Fed is what they actually wanted, investors sent the S&P 500 to a new 52-week low close of 2506.96, down 1.54%.
Facebook (NASDAQ:FB) led the charge, losing 7.3% of its value mostly in response to news that Washington, D.C., attorney general is filing a lawsuit against the company for its role in the Cambridge Analytica scandal. Micron Technology (NASDAQ:MU) logged a bigger loss, however, closing 7.9% lower in response to a grim near-term outlook.
There were some winners, though few and far between. General Electric (NYSE:GE) was up 5.2% on Wednesday following news that the company may be close to spinning off its healthcare arm. There just weren’t enough winners to let the market sidestep Wednesday’s bloodbath.
Headed into Thursday’s session, traders may want to take closer looks at stock charts of Verizon Communications (NYSE:VZ), McCormick & Co (NYSE:MKC) and Alexandria Real Estate Equities
(NYSE:ARE). All budding trends are tentative, but these three names are still your highest-odds possibilities.
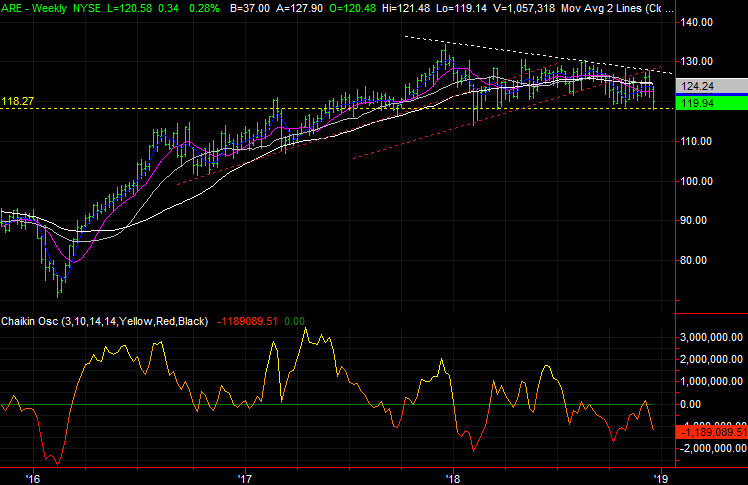
Alexandria Real Estate Equities (ARE)

It has got more to do with market dynamics than with the REIT itself, but the underlying reason doesn’t really matter. Alexandria Real Estate Equities, which specializes in providing office space for the biopharma industry, is slowly but surely slipping into a downtrend.
One or two more rough days could push ARE over the cliff’s edge.
Click to Enlarge
• Although it’s not beyond salvaging just yet, a move below the recent lows at $118 would mark the stock’s first lower low in years.
• Underscoring the likelihood of a sizable move lower is building bearish volume. The setbacks on Monday and Wednesday both unfurled on much higher volume, suggesting sellers may be waiting in the wings.
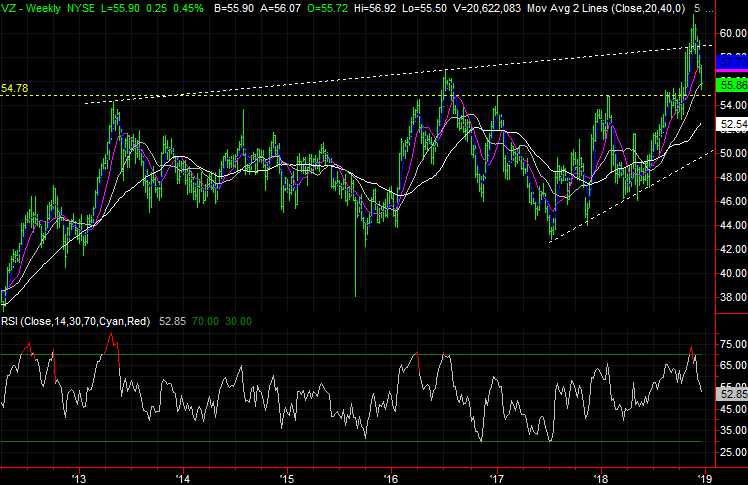
Verizon Communications (VZ)
Verizon shares have been undeniably overbought for a while. Indeed, since peaking in the middle of last month, VZ stock has drifted lower, with the weight of a huge runup since the middle of the year bearing down. It’s all unfurling just as scripted.
Curiously though, even while the rest of the market has been melting down so far this week. Verizon has remained propped up at a relatively reliable technical floor. If nothing else, the technical support has to be respected.
Click to Enlarge
• The weekly chart indicates just how overbought Verizon was a month ago, by virtue of an RSI indicator that reached above 80. The move lower in the meantime has yet to push VZ back into an oversold condition.
• The former support level near $55.30, marked with a yellow dashed line, may have since turned into a floor that’s lending the 100-day moving average a helping hand.
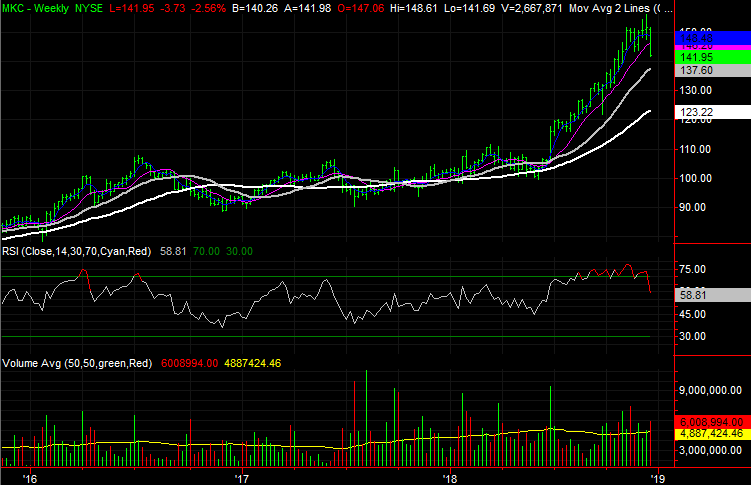
McCormick & Co (MKC)
Finally, the past six months have been unusually bullish ones for shares of McCormick & Co. MKC stock was up as much as 48% from June’s average price, and though ripe for profit-taking, it managed to keep chugging higher.
Everything started to change on Monday, however. With investors finally embracing the risk, a little selling has turned into a lot of selling in terms of volume and speed. With selling momentum in place, don’t be shocked if McCormick continue to tumble even if the broad market doesn’t.
Click to Enlarge
• Underscoring the breakdown is the level of volume we’ve seen behind it. And, as of yesterday, it’s still growing.
• Potential landing spots include the gray 100-day moving average line and, more plausibly, the white 200-day moving average line currently at $122.
As of this writing, James Brumley did not hold a position in any of the aforementioned securities. You can follow him on Twitter, at @jbrumley.