Another day of indecision. The market is at least holding its ground above a key technical floor, even though the S&P 500 lost 0.18% of its value on Friday. It even logged a gain for the week. But, it’s clear investors remain hesitant.

The bulls weren’t hesitant about Sprint (NYSE:S), pushing it up nearly 3% on renewed optimism the Federal Trade Commission could give its impending merger with T-Mobile (NASDAQ:TMUS) a green light as early as next week after all. A much-ballyhooed Beyond Meat (NASDAQ:BYND) jumped more than 7% on news that its primary rival, Impossible Burger, was struggling to meet demand for its product.
There just weren’t enough names like Beyond Meat and Sprint to overcome dead weight like Advanced Micro Devices (NASDAQ:AMD). AMD shares fell more than 3% after rival Broadcom (NASDAQ:AVGO) lowered its full-year guidance.
None of those names make for great trading prospects today, however … too much unpredictable volatility. Rather, it’s the stock charts of Charles Schwab (NYSE:SCHW), Allergan (NYSE:AGN
) and Centurylink (NYSE:CTL) that are worth closer looks. Here’s why.
Centurylink (CTL)
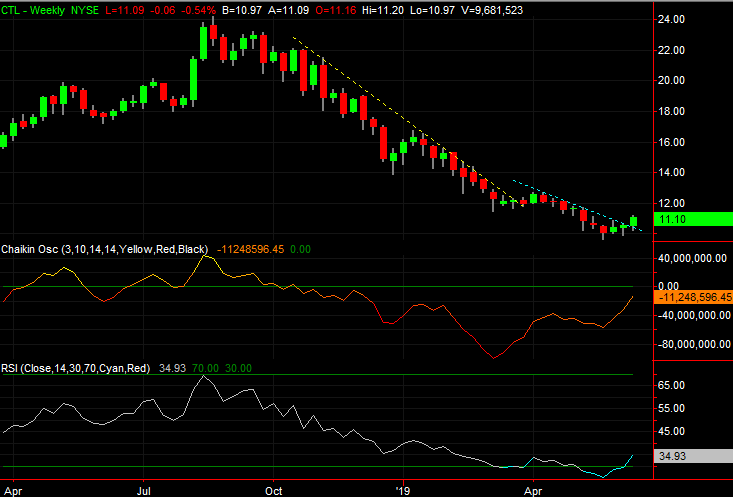
We’ve seen fakeout moves from Centurylink shares before, so take this one with a grain of salt. But, this one is different in the sense that it’s starting to take hold after a major selloff that has left the stock oversold and ripe for a rebound. There’s just one more hurdle to clear, though it’s not a small one. It has proven to be a ceiling in the past, though in slightly different circumstances.
Click to Enlarge
- The slow break above the falling resistance level marked in yellow on both stock charts ultimately petered out, but the break above the falling ceiling plotted with blue lines since April seems to be taking shape at a much stronger pace.
- This time around the rebound move is materializing after the weekly chart’s RSI indicator fell well into oversold territory. The move out of that condition in the meantime is a sign that a reversal is underway.
- The key from here is a move above the purple 50-day moving average line. That level was a ceiling a couple of times in the fall of last year, but that was when the selloff was just getting started. It really is a different scenario now.
Allergan (AGN)
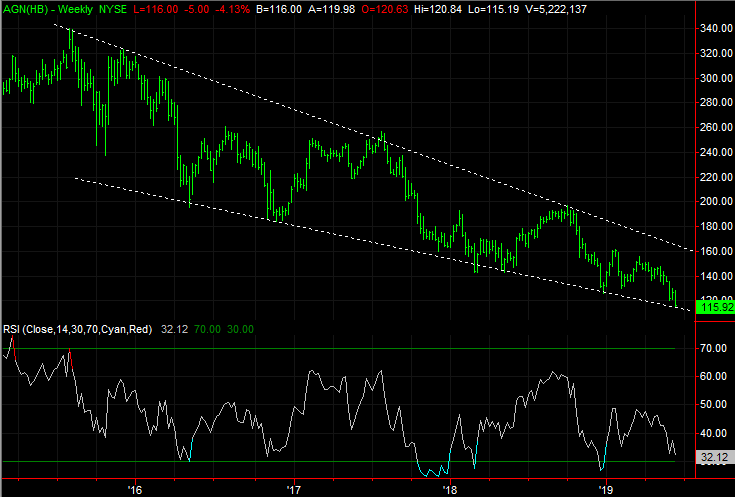
Long-term Allergan shareholders are no stranger to disappointment. The stock has been in a choppy downtrend since 2015, managing to reach new multi-year lows on Friday of last week. It looks and feels like the stock is about to implode.
And, maybe it is. But, with Friday’s 4.1% meltdown, AGN stock has actually bumped into a very well-established technical floor that could throw bears for a loop. Although some sort of verification is necessary before jumping to any conclusions, the binary outcome that has to take shape from here is apt to offer some significant swing trading opportunities no matter what.
Click to Enlarge
- As of Friday, Allergen shares are kissing the lower edge of a converging wedge pattern that extends back to 2015.
- The bullish case is simple enough — at a major floor and with the weekly chart’s RSI indicator almost into oversold territory, another rebound could be imminent. The bulls will have to confirm that’s going to happen with a bounce this week.
- It’s not a very well watched dynamic, but thanks to Friday’s tumble, AGN shares are now 25% below their white 200-day moving average line. That was about the maximum divergence allowed to take shape in late 2017 and early 2018, also bolstering the bullish case.
Charles Schwab (SCHW)
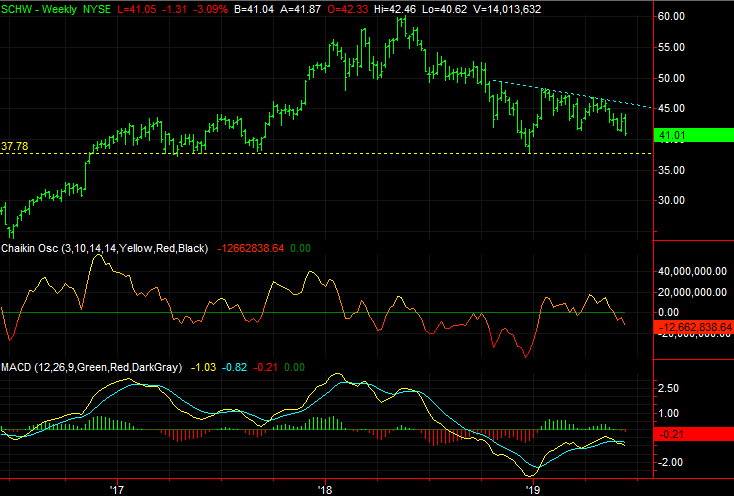
A month ago, Charles Schwab shares were toying with a recovery move. Although a falling resistance line was still intact, a handful of other bullish clues were materializing.
The effort never panned out. Instead, SCHW bumped into that technical ceiling one last time, fell back again and then continued to fall. The last bastion of hope was wiped away on Friday with a 3.1% setback that dragged Charles Schwab shares back to their lowest level in months. And, that’s not even the worst of it.
Click to Enlarge
- The resistance line that remains intact is plotted in blue on both stock charts, tagging all the key highs since November.
- Support was developing around $41.40, by virtue of shares making a couple of major lows there since March. That floor was smashed on Friday.
- Although anything is still possible at this point, with a floor now taken out of the picture, the next most likely landing spot is the most frequent low seen since early 2017. That floor near $37.80 is marked in yellow on both stock charts.
- From the perspective of the weekly chart, the pattern since early 2017 loosely looks like a head-and-shoulders pattern. Should the “neckline” at $37.80 also fail, the ensuing selloff could be significant.
As of this writing, James Brumley did not hold a position in any of the aforementioned securities. You can learn more about James at his site, jamesbrumley.com, or follow him on Twitter, at @jbrumley.