U.S. started off Tuesday with another surge, but have since backed off those gains a bit. Remember, exactly one week ago equities posted a stunning “Turnaround Tuesday” that led to a flurry of buying. Now we need to see if it will last. Let’s look at a few must-see stock charts for Wednesday.
Must-See Stock Charts #1: Sprint
Click to Enlarge
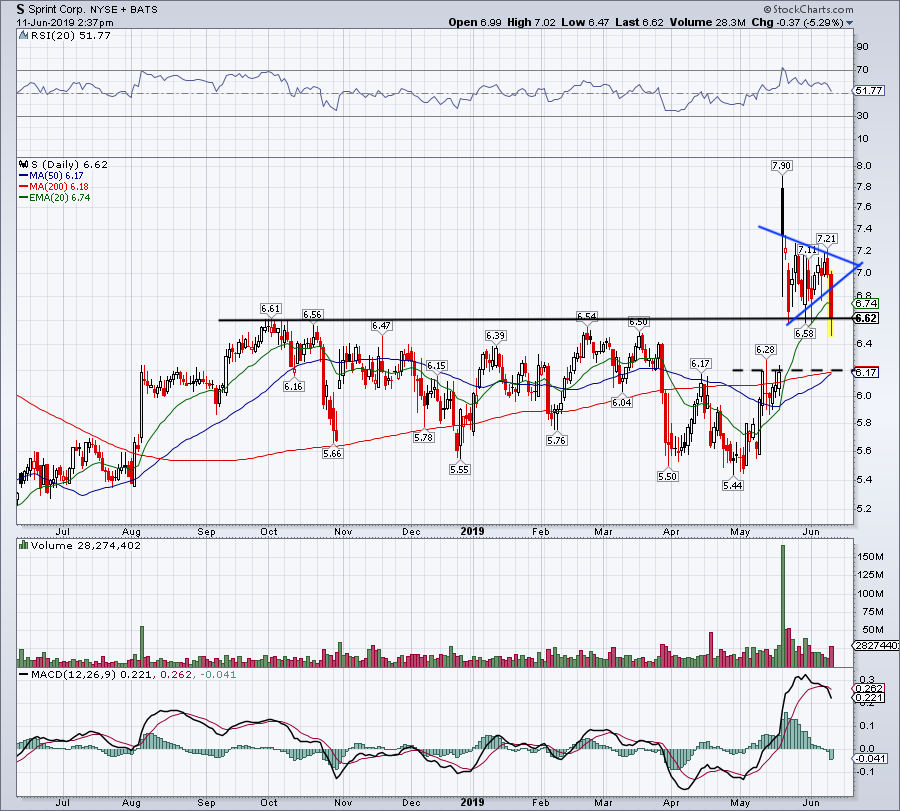
Worries on whether the Sprint (NYSE:S) merger with T-Mobile US (NASDAQ:TMUS) will go through are hurting both stocks on Tuesday.
Shares of Sprint were forming a bullish pennant (wedge) up near $7. However, if the stock loses $6.60, it increases the odds of a gap fill back down toward $6.20. Around this level it will also find the 50-day and 200-day moving averages.
If S declines this far and finds support, it may prove to be an advantageous buying opportunity. For now though, it looks like $6.60 support is suspect.
On the upside, see if S can reclaim its 20-day moving average and $7.
Must-See Stock Charts #2: CVS Health
Click to Enlarge
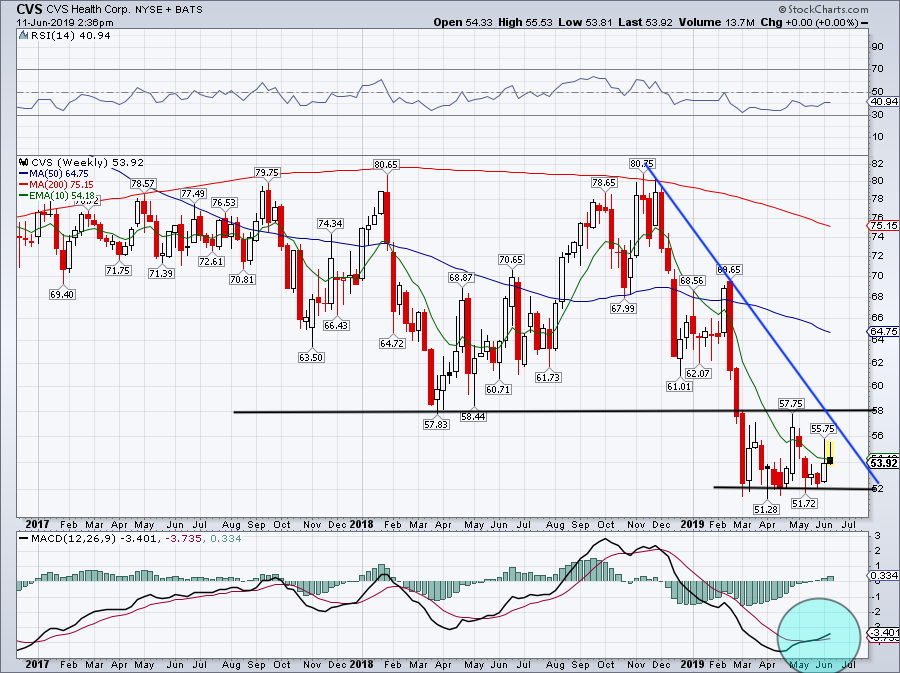
Sprint and T-Mobile aren’t the only ones having trouble. CVS Health (NYSE:CVS) and Aetna are too, with a judge threatening to nix their deal.
A day after we saw some massive tie-ups — United Technologies (NYSE:UTX) and Raytheon (NYSE:RTN), as well as Salesforce (NYSE:CRM) and Tableau Software (NYSE:DATA) — it’s interesting to see M&A issues on Tuesday. (Here’s how we’re trading those names).
In any regard, how do we trade CVS stock now?
Prior support was present near $58. We’re now seeing that level act as resistance while $52 has become support. If CVS can’t maintain the 10-week moving average, $52 will likely be called upon again. In that scenario, it may be a low-risk buying opportunity.
Over the 10-week moving average and CVS can test $58 range resistance, but keep in mind that downtrend resistance (blue line) could weigh on it.
Must-See Stock Charts #3: Beyond Meat
Click to Enlarge
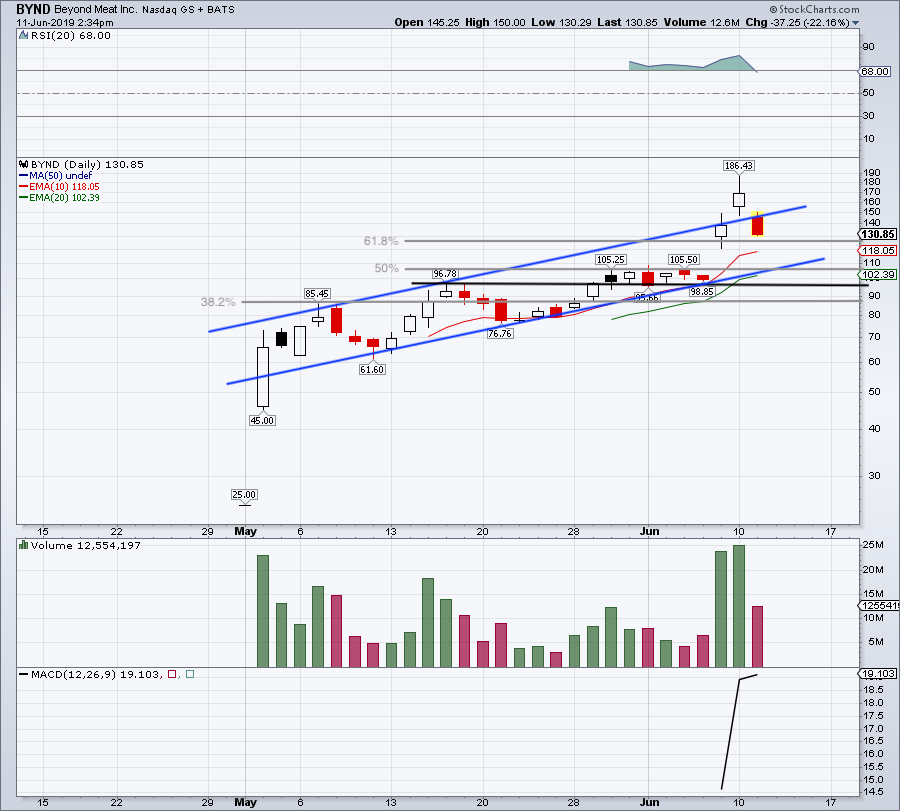
This thing has been insane, with Beyond Meat (NASDAQ:BYND) racking up almost 700% gains from its IPO last month to this month’s high. I haven’t seen such craziness since Tilray (NASDAQ:TLRY) went public last year.
Is the rally finished? I have no idea, but I find jumping in on the action more akin to gambling than trading and certainly when compared to investing.
Shares are now back below channel resistance (blue line). While its 61.8% retracement could buoy the name near $125, a larger correction down toward $105 to $110 may be in store for BYND.
This one is too volatile for me, but it’s a fun one to observe. It’s a great lesson in a simple concept: There are thousands of stocks out there. You don’t have to trade them all.
Must-See Stock Charts #4: BlackBerry

Click to Enlarge
BlackBerry (NYSE:BB) was putting in some nice gains on Tuesday, before giving half of them up and pulling back. Shares are being rejected by the 10-week moving average and the 20-day moving average.
Just as a note, the above chart is a weekly one and will not display daily moving average figures, although I will mention them here.
Bulls want to see this month’s lows near $7.75 hold as support. Below that and a drop to $7 and possibly lower is on the table. Above the 10-week and a larger rally can occur.
And while we see downtrend resistance up near $9.50, BB has a lot of resistance to clear first. At $8.91 and $9.07 is the 200-week and 50-week moving averages, respectively. Further, the stock has its one-year 61.8% retracement at $8.85, the 50-day moving average at $8.76 and the 200-day at $8.88.
That’s a lot of numbers, but on the chart it’s displayed simply as a blue box. Unless BlackBerry can clear $9, I would rather sell into that area rather than bet on a breakout. The risk/reward (and odds) are better.
Must-See Stock Charts #5: GrubHub
Click to Enlarge
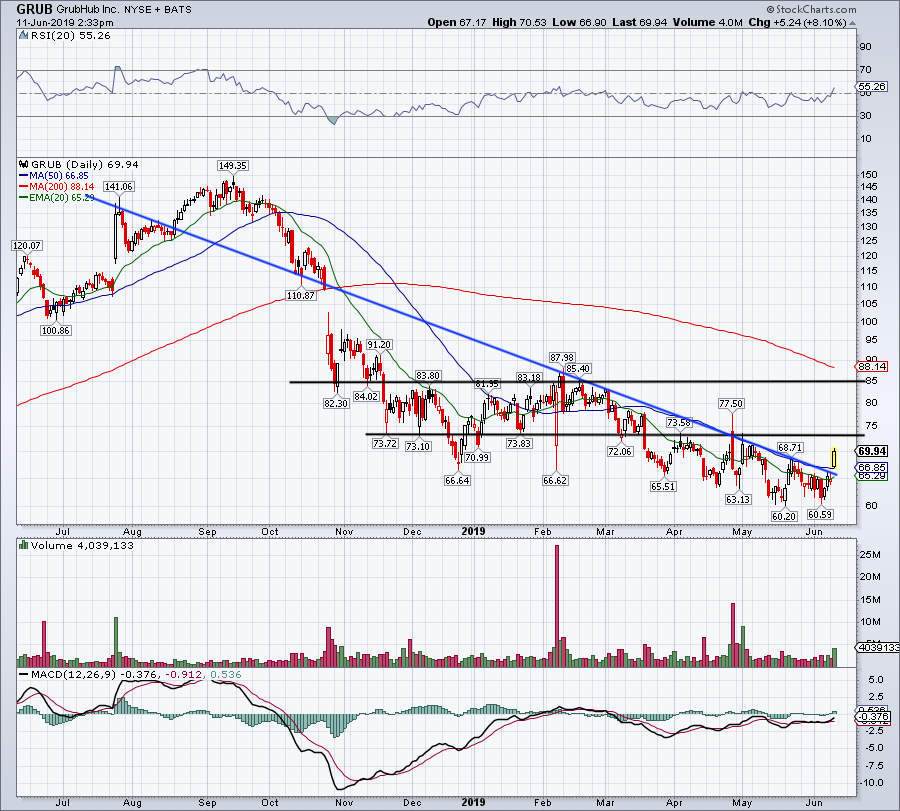
News of Amazon (NASDAQ:AMZN) ending its Amazon Restaurants segment gave GrubHub (NYSE:GRUB) a lift, up 8% on Tuesday.
Shares now need to maintain $65+ to go higher. If it can’t stay above this level, it means GrubHub will have fallen back below downtrend resistance, as well as the 20-day and 50-day moving averages.
I’m now looking for a move back to $73. Above that and $85 seems possible, unless GRUB hits its descending 200-day moving average first.
Bret Kenwell is the manager and author of Future Blue Chips and is on Twitter @BretKenwell. As of this writing, Bret Kenwell is long AMZN.