
They say October is the worst time of year for the stock market. Some years that doesn’t apply, but in 2018, the markets are living up to their seasonal reputation. It’s left a number of major market indices looking rather ugly.
Ranging from the S&P 500 to the Volatility Index to foreign indices, it’s a painful look for the bulls right now. However, knowing the key levels to watch can help investors know when to stay defensive and when to strategically deploy their capital.
On Wednesday October 24th, the market started to feel panicky. Despite the declines, it hasn’t really felt like panic in the market. I hate to say it, but bulls, we need panic to get a capitulation. Once that happens, we can bottom and the indices can go on their Santa Claus rallies.
Obviously fund managers have a lot of ground to make up and would love nothing more than to ramp stocks into year end. With that in mind, let’s see what we’re working with.
Major Market Indices to Trade: S&P 500

Click to Enlarge
The chart above is on the S&P 500, but stock traders can also use the SPDR S&P 500 ETF (NYSEARCA:SPY). Many funds, managers and investors use the S&P 500 as the benchmark for their returns and it’s a main focus for the health of U.S. stocks.
So what does it say?
The 100-day has been a significant moving average over the past year. Meaning that this month’s bounce that failed at the 100-day was rather disappointing. The amount of time the index is spending below the 200-day is also concerning. It’s got a lot of bulls and managers defensive and with good reason. Below the 200-day is never a good development for investors.
Note that even during the winter meltdown in February, the S&P 500 gave plenty of respect to the 200-day. I wouldn’t blame longs one bit if they waited for a close over the 200-day before adding to long positions.
On the downside, look to see if the trend-line from the lows (blue line) holds as support. That’s right near 2,650 or just below Wednesday’s lows. Below that and the 2,575 to 2,600 area should help support the index. Maybe a flush down to this level is what’s needed to get some panic and capitulation.
Major Market Indices to Trade: Nasdaq
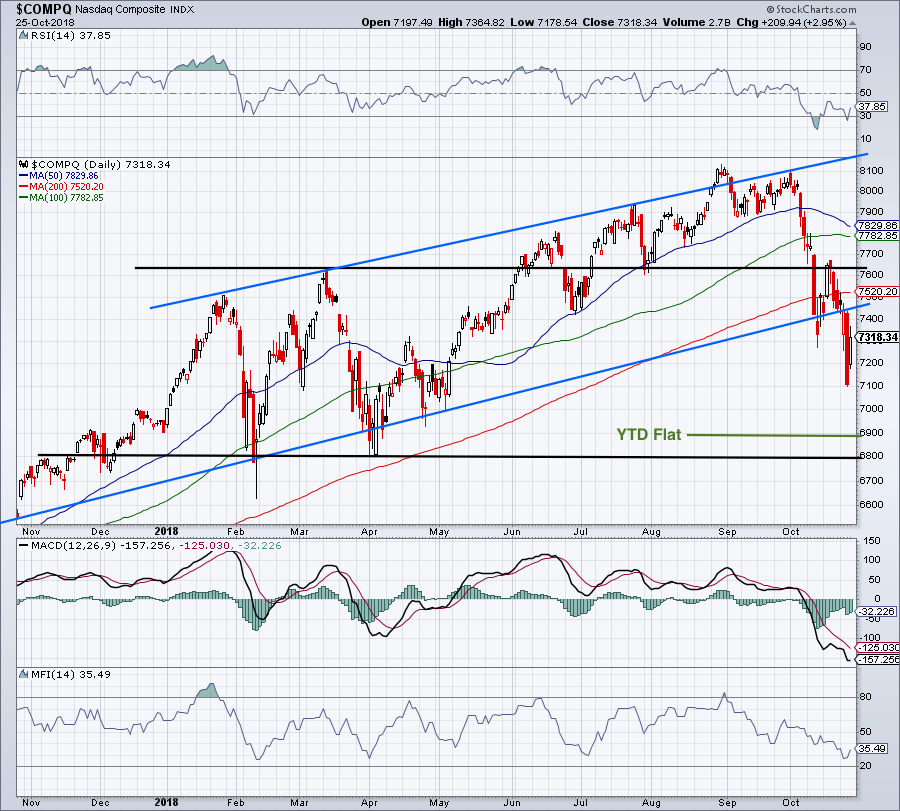
Click to Enlarge
Some prefer to trade the Nasdaq via the PowerShares QQQ ETF (NASDAQ:QQQ), but either way the action has been ugly.
The Nasdaq rallied back to the 7,600-ish breakout level earlier this month and failed. That’s bad news for the bulls, as is the break below the 200-day moving average and uptrend support (blue line).
Amazon’s (NASDAQ:AMZN) post-earnings selloff will really test the Nasdaq on Friday and perhaps early next week. We’ll see what that does to the overall index, but to get the Nasdaq down to year-to-date flat and the 6,800 support levels, we’ll need to see these big tech names falter. Specifically, names like Apple (NASDAQ:AAPL) will really need to crack.
On a rally, see how the Nasdaq does with the 200-day and the backside of uptrend support.
Major Market Indices to Trade: Dow Jones Industrial Average
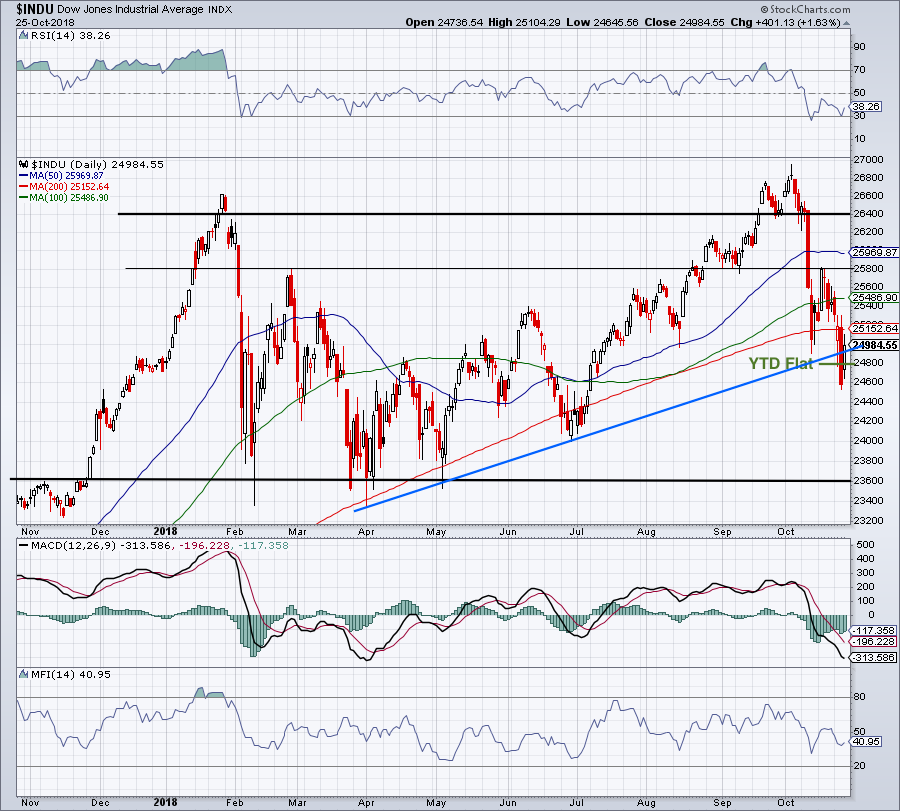
Click to Enlarge
Some prefer to trade the Dow Jones Industrial Average via the SPDR Dow Jones ETF (NYSEARCA:DIA). Could a fall to 23,600 be in the cards? For it to happen, the Dow will need to see big-time names like Apple, Boeing (NYSE:BA) and United Health (NYSE:UNH) break down.
Like the Nasdaq and S&P 500, the Dow has been under pressure. Back over the 200-day and perhaps the Dow can get some momentum. Over the 25,800 level and perhaps the highs near 27,000 are in target. That seems optimistic right now, but remember, the Dow is powered by just 30 stocks. So a sustained market bounce could really move this name.
That said, a 30-stock weighting can cut both ways. Should names like AAPL, BA and UNH start to falter, the Dow could tumble. Down near that 23,600 mark, the index should have strong support. That’s about 1,000 points below Wednesday’s low. While it sounds like a lot, we could see those losses in just one session — and have before.
Major Market Indices to Trade: Russell 2000
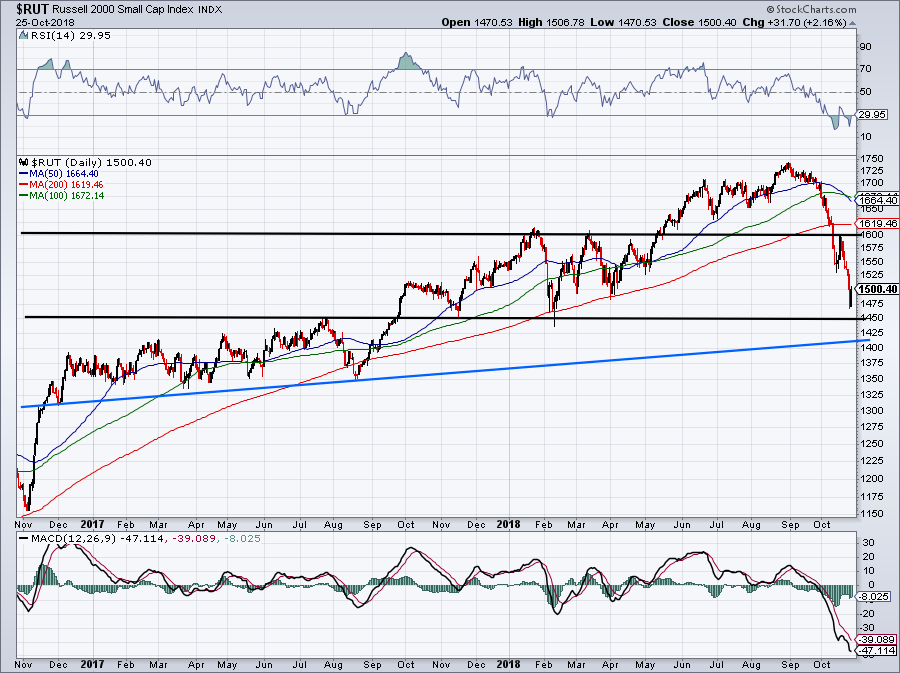
Click to Enlarge
Small caps are incredibly important to pay attention to right now. Notice how they topped out at the beginning of September? This occurred a month later for the S&P 500, Nasdaq and Dow. In other words, the Russell 2000 has been the leader and those subtle losses in September turned down right toxic in October.
Even with Thursday’s multi-percent bounce, the Russell is still down almost 14% so far in October.
The prior breakout level near 1,600 not only failed as support earlier this month, but also acted as resistance in mid-October. That’s not good news. If any positive catalyst exists, it’s that the 1,450 level has been a rough area of support so far this year. Beyond that, the low end of its two-year uptrend (blue line) is just below that mark at 1,425.
A rally back to the 200-day would represent an 8% rally from current levels and no doubt put investors in a better mood. But failing here could be catastrophic for the rest of the stock market. Watch the Russell or the iShares Russell 2000 ETF (NYSEARCA:IWM
) closely.
Major Market Indices to Trade: The VIX
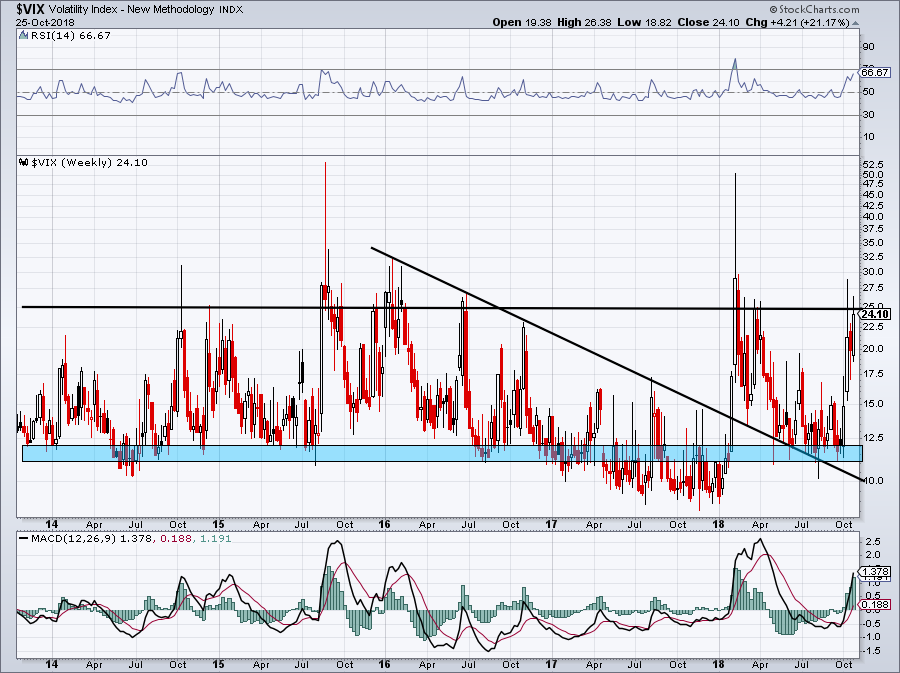
Click to Enlarge
Overanalyzed by some, under-followed by others, the CBOE Volatility Index (INDEXCBOE:VIX) is one to watch as well. Known as the “fear gauge” to some, the VIX gives a good temperature reading on investor sentiment. The higher the VIX is, the more panic and worry we have in the market. The lower the VIX is, the lower volatility is.
2017 was a bit of an anomaly for the VIX, as volatility was significantly suppressed. That’s as investors sold volatility and bought equities. Eventually that trade blew up though, causing the huge unwind in February of this year. But what does the VIX say right now?
The VIX does not generally go below $11 to $12 very often. That roughly marks the bottom of the channel. On the upside though, rarely can it sustain above $25. At $24.10 on Thursday’s close, watch this $25 mark.
If it can keep a lid on the VIX, we might be able to see it fall back below $20 and into the teens. If that’s the case, stocks can rally. However, a pop over $25 will reflect an ugly situation in the stock market. That’s not to say that the VIX will stay over that mark, but a run up to $30 will cause some issues for bulls.
Note that the VIX ran to roughly $50 twice in the past five years, once during the 2015 flash crash and earlier this year during the short-vol/long-equities unwind. I don’t expect another run to $50 this year. But a pop to or above the $27.50 to $30 range will cause more turmoil.
Major Market Indices to Trade: Semiconductors

Click to Enlarge
The fall in this sector has caused a lot of turmoil. Names like Broadcom (NASDAQ:AVGO), Nvidia (NASDAQ:NVDA), Advanced Micro Devices (NASDAQ:AMD), Qualcomm (NASDAQ:QCOM), Intel (NASDAQ:INTC) and others have certainly paid the price of the breakdown in the Semiconductor Index (INDEXNASDAQ:SOX).
Some trade this sector with the Vaneck Semiconductors ETF (NYSEARCA:SMH), but in both cases it’s been a tough ride.
Like FANG, the Nasdaq will need the semis to bottom before a sustained rally can occur. Many smart traders were watching the converging wedge on this index, which has been occurring all year (blue lines forming the wedge on the chart).
Once support failed, this name went on a treacherous decline, knifing right through 1,220 support. Can 1,150 act as support? Those who want to go long can use a close below this level as their stop-loss. Some would rather wait for a rally back over 1,220 before buying. Who can blame them?
Given today’s products and technologies, I don’t personally find the semi group as cyclical as it once was. Sentiment can be a hard thing to change though, so let price be your guide. Below 1,150 and more downside could come. Over 1,220 and maybe we can get a retest of prior support.
Major Market Indices to Trade: The Dax
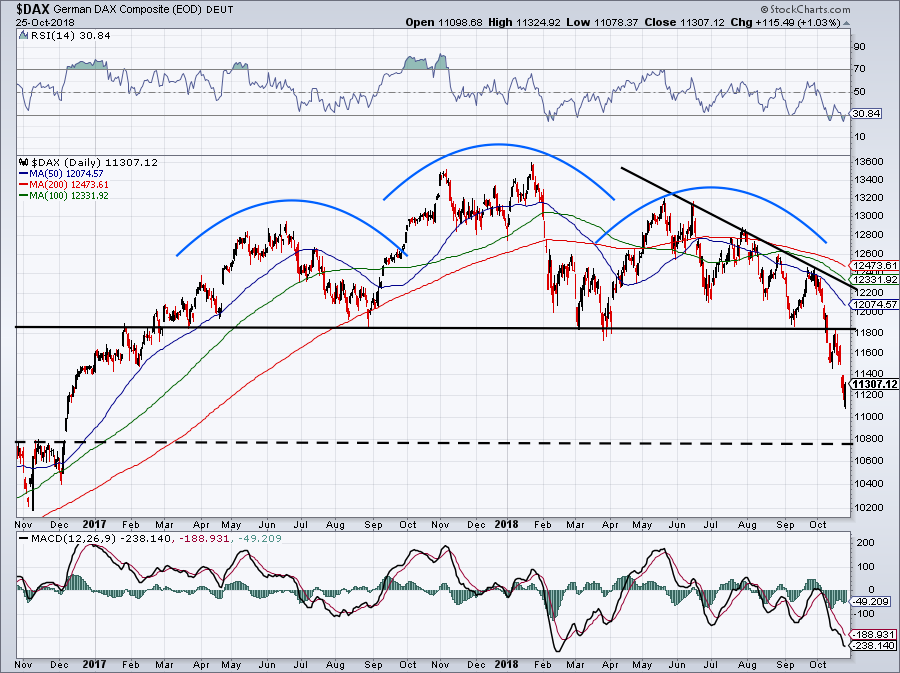
Click to Enlarge
Think of the DAX (INDEXDB:DAX) as Germany’s version of the Dow. Unlike U.S. stocks, this has been weak for a while, but nonetheless investors should at least be aware of its performance. Particularly considering how big the German economy is in Europe.
Down almost 20% on the year, October has put a real exclamation point on this index’s performance. It broke below major support between 11,800 and 12,000 and then failed to break back above those levels on the retest. I’m not a big head-and-shoulders trader, but we have a rather obvious one here and it’s not pretty.
On the upside, see if the DAX can get back above this prior support range. On the downside, the ~10,800 mark is on the table. To watch the Dax, some may prefer to monitor Germany via the iShares MSCI Germany Index ETF (NYSEARCA:EWG).
Bret Kenwell is the manager and author of Future Blue Chips and is on Twitter @BretKenwell. As of this writing, Bret Kenwell was long AAPL and NVDA.