It wasn’t pretty, or easy, but the market managed to log another victory on Friday — the fourth winning day of the past five. The S&P 500’s close of 2,822.48 was the index’s best close since early November, yet the budding uptrend remains far from rock-solid.
 Qualcomm (NASDAQ:QCOM) led the way with its 2.2% advance, mostly in response to reports that it won a relatively important patent-infringement court case against Apple (NASDAQ:AAPL). Though more are still pending, it was perceived as a good step. Leap Therapeutics (NASDAQ:LPTX) logged one of the day’s biggest gains among major names, however, up 21.6% during regular-hours trading and adding another 12% in Friday’s after-hours action for reasons most investors have yet to figure out.
At the other end of the spectrum, Tesla (NASDAQ:TSLA) fell a little more than 5% after watchers were ho-hum about Thursday’s evening’s unveiling of the new Model Y.
None make for particularly great trading prospects of the new trading week. Rather, it’s the stock charts of Kimberly Clark (NYSE:KMB), Morgan Stanley (NYSE:MS) and Applied Materials (NASDAQ:
AMAT) that merit the closest technical look to kick off the new trading week.
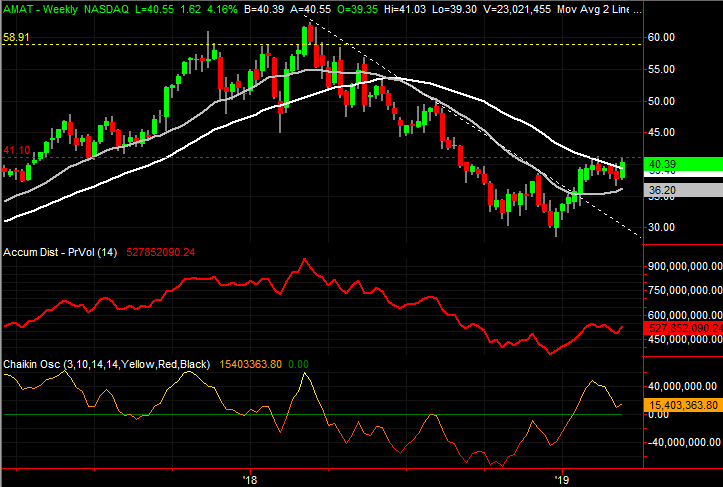
Applied Materials (AMAT)
Applied Materials broke out of a downtrend several weeks ago, as first suggested was possible in late November. The effort got off to a great start too, up until AMAT stock bumped into resistance at its 200-day moving average line, plotted in white on both stock charts.
That hurdle was cleared on Friday though. There’s one more ceiling to clear, but the undertow is pointed in the right direction.
Click to Enlarge
• The current uptrend was kicked off with the ideal prompt … support and a push up and off of the purple 50-day moving average line (highlighted).
• We’ve seen several accumulation days since January, or high-volume gains that indicate there are plenty of would-be buyers willing to feed the rally effort.
• If the $41.30 ceiling can be cleared, the next major ceiling is the late-2017/early-2018 resistance around $59, plotted with a yellow-dashed line.
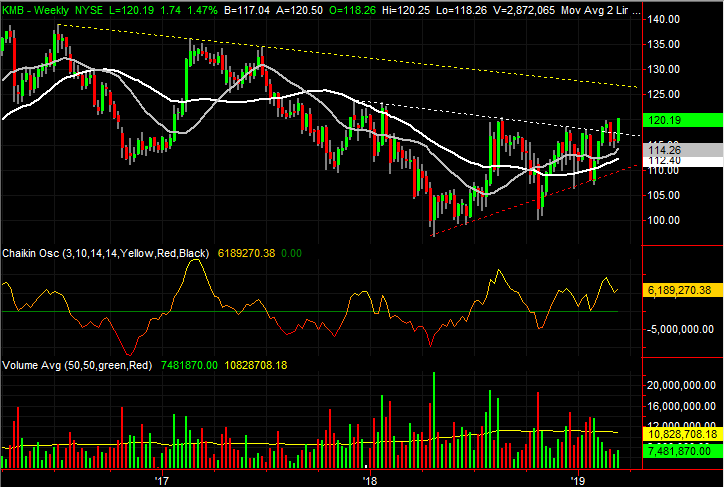
Kimberly Clark (KMB)
In late February Kimberly Clark was pegged as a breakout candidate. Shares had just broken out of a long-term converging wedge pattern by breaking above the upper boundary of a shrinking trading range.
That effort actually petered out soon thereafter. But, the potential never really went away. With a small pullback and the reversal at the exact right place, that effort has been rekindled bigger and better than it was three weeks ago.
Click to Enlarge
• The lull in late February and early March was the perfect pullback and regroup. All it took was a brush of the purple 50-day moving average line (highlighted) to supply the rally’s second wind.
• The next most plausible target is currently around $126, where the resistance line that’s tagged the peaks from 2016 and 2017 awaits. That resistance marked with a yellow dashed line.
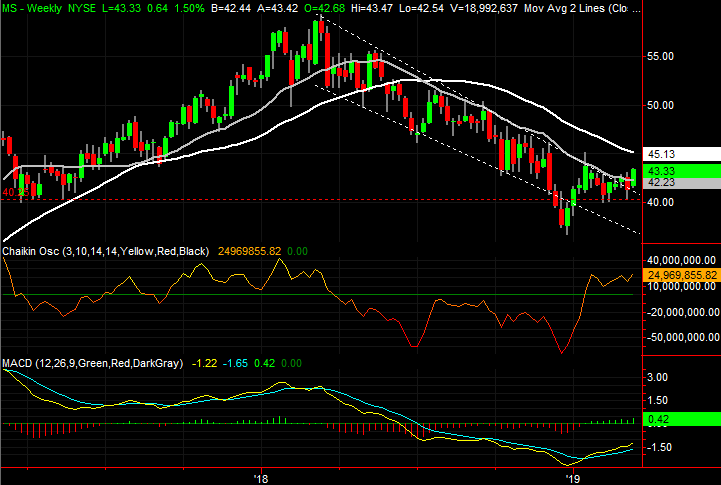
Morgan Stanley (MS)
Most interested investors respect the 1.5% gain Morgan Stanley made on Friday, and the 4.7% advance it booked for the week. That’s more than the broad market mustered.
There’s far more to Friday’s action than readily meets the eye, however. With that small move, MS made a big dent in a ceiling that had been guiding it lower for months now. Better still, it did so on higher volume, suggesting there’s a swath of potential buyers waiting in the wings.
Click to Enlarge
• On the weekly chart, we’ve got a bullish MACD cross and a Chaikin line that’s above zero, confirming the undertow is bullish.
• If the breakout thrust gets traction, the line to watch as a potential technical ceiling is the white 200-day moving average line, currently at $45.62.
As of this writing, James Brumley did not hold a position in any of the aforementioned securities. You can learn more about James at his site, jamesbrumley.com, or follow him on Twitter, at @jbrumley.