Tuesday was another disappointing day for U.S. stocks. The S&P 500 again failed to hold 3,000, with an afternoon sell-off driving it below that level. The Dow Jones Industrial Average closed down only modestly, but saw steep declines from components McDonald’s (NYSE:MCD) and Travelers Companies (NYSE:TRV).

But for both indices, choppy overall trading obscured relatively large moves in key sectors. In the S&P 500, for instance, information technology stocks fell a sharp 1.4%. Meanwhile, energy names gained by nearly the same amount.
Those mixed moves aren’t new. Indeed, choppy trading in broad market indices for most of 2019 has masked relatively big changes in underlying categories. Wednesday’s three big stock charts highlight that trend.
And the lesson from these big stock charts — and market-wide trading for several months — seems relatively simple. Investors, for the first time in some time, are starting to pay close attention to valuations. These charts may show whether that will remain the case.
Starbucks (SBUX)
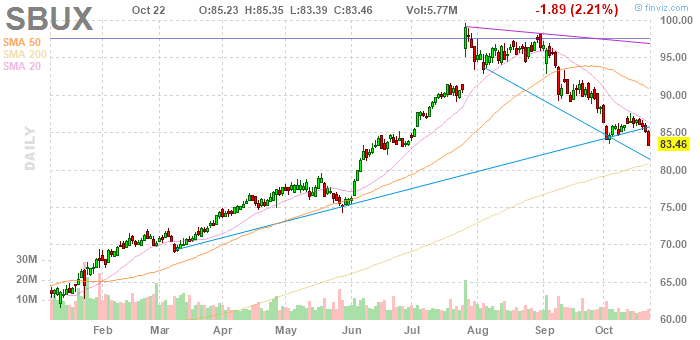
There are two questions at the moment when it comes to Starbucks (NASDAQ:SBUX). The first is: why is SBUX stock tumbling? And the second is: where is the bottom? Neither question has a simple answer, but one of our big stock charts gives some clues:
- Technically, the stock appears to have more downside heading into fiscal fourth quarter earnings next week. The 20-day moving average clearly held as resistance in recent sessions. The downtrend is firm, with SBUX stock closing below early-month lows after a 2%-plus decline on Tuesday. The hope from a chart standpoint would be that the 200-day moving average acts as support. If it doesn’t, SBUX can dip back into the $70s.
- Fundamentally, Starbucks does have a potential catalyst in next week’s fourth quarter report. But the company already lowered expectations for fiscal 2020 last month, which disappointed investors and contributed to the recent selling pressure.
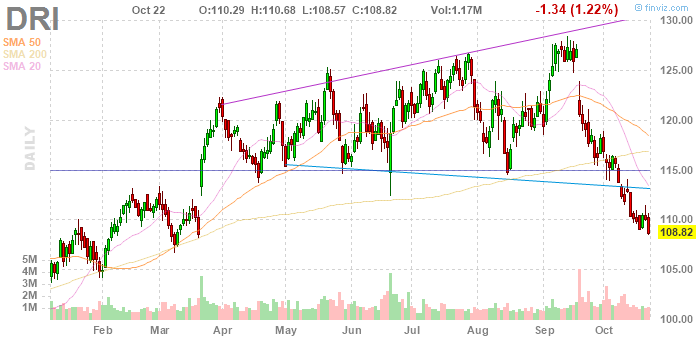
Click to EnlargeAnd so this looks like a decline driven by valuation and sector concerns. As we noted in this space last week, Darden Restaurants (NYSE:DRI) has seen a similar downtrend. Margin weakness at McDonald’s no doubt drove Tuesday’s selling in SBUX.- Industry trading aside, SBUX stock became exceedingly expensive near $100. It’s still not cheap yet, at 27x current fiscal 2020 consensus earnings per share estimates despite a long-term outlook of roughly 10% annual growth. If investors are worried about earnings multiples, as appears to be the case, that would support the chart, which seems to signal further downside at least through next week’s earnings release.
Nordstrom (JWN)
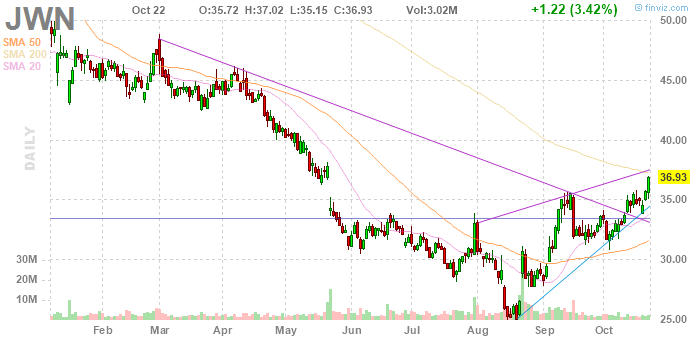
If investors are selling ‘expensive’ stocks while market indices hold firm, it would follow that those same investors are buying ‘cheap’ stocks. That looks like the case, with Nordstrom (NYSE:JWN) a good example. The retailer has seen its stock bounce a healthy 40%-plus from August lows. But the second of our big stock charts isn’t all good news:
- Technically, the recent breakout does seem to have room to run if JWN stock can break the 200-day moving average. But zooming out on the chart shows that JWN, like most retail stocks, has been here before. JWN shares gained 30% in a three-month run last year. They rallied in mid-2016 and late 2017. Any investor buying those rallies regretted it: August levels represented a post-crisis low for JWN stock.
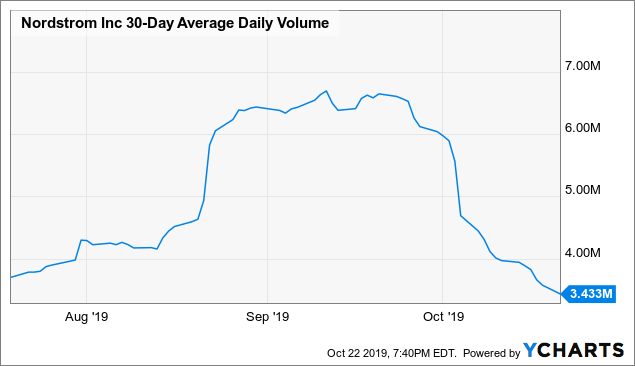
Click to EnlargeThe 200-DMA represents one technical challenge in the near-term, but the chart shows another reason for caution. The leg of the rally since early this month has come on lower volume. Low-volume rallies usually are considered weaker than those with heavy buying, which raises risk to the gains past $30.- Fundamentally, JWN stock does look cheap at a little over 11x consensus earnings expectations for this year. A 4% dividend yield also helps the case. But cheap, high-yielding retailers have often proved to be value traps. A similar case has been made at fellow department store operator Macy’s (NYSE:M) for years, and that stock has been in a steady downtrend (and now yields a whopping 9.5%).
- The rise in stocks like JWN, Bristol-Myers Squibb (NYSE:BMY), CVS Health (NYSE:CVS) and others show an increasing preference for value over growth. But with expectations clearly rising ahead of earnings next month, a questionable chart, and unspectacular fundamentals, JWN looks like a worrisome beneficiary of that shift.
Salesforce.com (CRM)
I’ve long argued that Salesforce (NYSE:CRM) is a wonderful barometer for investor sentiment. After all, there’s little debate about the quality of Salesforce’s business. Revenue has grown at a 20%-plus clip for years now. Its competitive positioning seems flawless, with Microsoft (NASDAQ:MSFT) a distant second with its Dynamics offering.
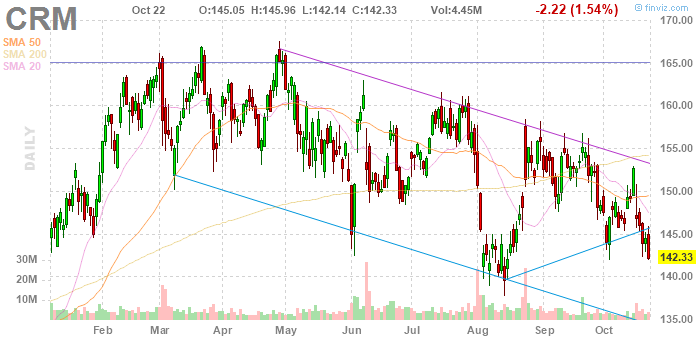
CRM stock for the most part is an argument about valuation. And as the chart shows, skeptics are winning that argument. For several reasons, that matters to both Salesforce stock and the market as a whole:
- As with SBUX, CRM stock is fading despite little news. The downturn isn’t quite as severe, but the downtrend is obvious and CRM stock is not far from testing August support around $140.
- CRM stock saw weakness before the rest of tech followed. Around the same time it peaked, unprofitable IPOs like Uber (NYSE:UBER) and Slack Technologies (NYSE:WORK) hit the market, and started falling almost immediately. Weakness then spread to high-growth SaaS plays like Alteryx (NYSE:AYX) and Splunk (NASDAQ:SPLK). Now, even the likes of CRM and, as noted yesterday, Adobe (NASDAQ:ADBE) are heading in the wrong direction. Increasingly, quality is not enough to offset valuation concerns in tech. Does weakness in SBUX and other consumer-facing stocks suggest that issue is spreading beyond tech as well?
- With earnings still a month out, CRM stock itself lacks a catalyst. And there’s an obvious question as to whether even a strong earnings report will be enough. One of the hallmarks of Salesforce in its 20 years has been consistency. Right now, investors simply don’t value that consistency the way they used to — which creates an awfully high bar for November’s report.
As of this writing, Vince Martin has no positions in any securities mentioned.