U.S. stocks suddenly look wobbly. On Friday, the S&P 500 posted its biggest one-day loss since October; all three major indices closed down for the week. That soft trading comes ahead of a key week for the markets.

After all, earnings season looms. Four of the five most valuable U.S.-listed companies — Apple (NASDAQ:AAPL), Microsoft (NASDAQ:MSFT), Amazon.com (NASDAQ:AMZN), and Facebook (NASDAQ:FB) — report earnings this week. Coronavirus fears appear to have driven Friday’s sell-off, and could add further pressure in the next few sessions.
The external environment certainly sets up at least the possibility of a pullback. Monday’s big stock charts focus on three names in a similar situation. Like the broad market, all three stocks are showing some near-term weakness after solid rallies. And, like the market, all three stocks could have more downside ahead.
CVS Health (CVS)
Beginning in August, CVS Health (NYSE:CVS) managed to escape the years-long pressure on pharmacy stocks. But as the first of Monday’s big stock charts shows, that pressure has returned:
- The technical picture looks worrisome. CVS stock established a broadening ascending wedge and now has made a textbook reversal to the downside. A five-session losing streak, during which time shares have dropped 6%, has come on reasonable volume. CVS stock at least did avoid closing at the lows on Friday, but it does seem like there’s at least a path back toward, if not to, the 200-day moving average around $62.
- Fundamentally, the sell-off looks like an opportunity. CVS stock trades at almost exactly 10x the 2020 consensus earnings per share estimate. A 2.8% dividend yield helps the case as well.
- That said, there’s some reason for caution when looking at the sector. Lower reimbursement rates and reduced savings from new generic drugs have pressured earnings across the industry. Even with a recent rally, Rite Aid (NYSE:RAD) stock is well over 90% below its highs. Walgreens Boots Alliance (NASDAQ:WBA) is even cheaper than CVS, and continues to slide after a post-earnings sell-off this months. With CVS earnings ahead on Feb. 12, investors may well fear a similar response.
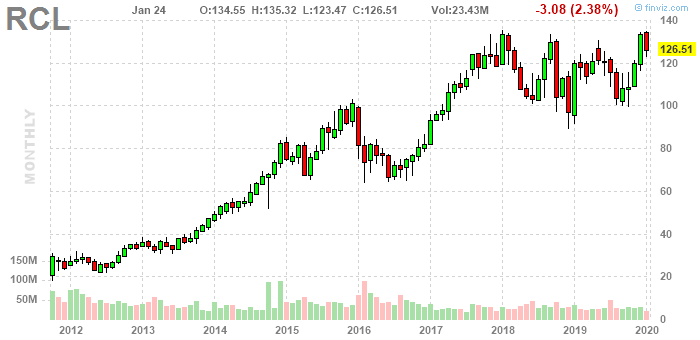
Royal Caribbean Cruises (RCL)
For Royal Caribbean Cruises (NYSE:RCL), the cause of the reversal almost certainly is growing fear about the spread of the coronavirus from China. But the second of our big stock charts shows other cause for concern:
- RCL made a bearish exit, this time from an ascending triangle pattern. Some support has held of late, with RCL climbing from intraday lows in each of the last two sessions and holding the 50-day moving average. Still, the benefit from a “golden cross” last month has played out. If selling pressure renews on Monday, as seems likely, the next two key levels are the 200DMA at $117 and then $115, which proved resistance last year.
-
Click to EnlargeSource: Provided by FinvizLike CVS, RCL does seem cheap enough to at least be intriguing. Both a 12x forward price-to-earnings multiple and a 2.5% dividend yield look attractive. Yet both Norwegian Cruise Lines (NYSE:NCLH) and Carnival (NYSE:CCL,NYSE:CUK) are cheaper, and CUK shares offer a 4.2% yield. Meanwhile, the longer-term chart shows that RCL has stalled out at current levels in the past.
- There might be a nice “buy the dip” case for Royal Caribbean stock. But the chart and the news surrounding coronavirus both suggest the dip may be severe, and investors will have choices if the likes of NCLH and CCL come down as well.
E*TRADE (ETFC)
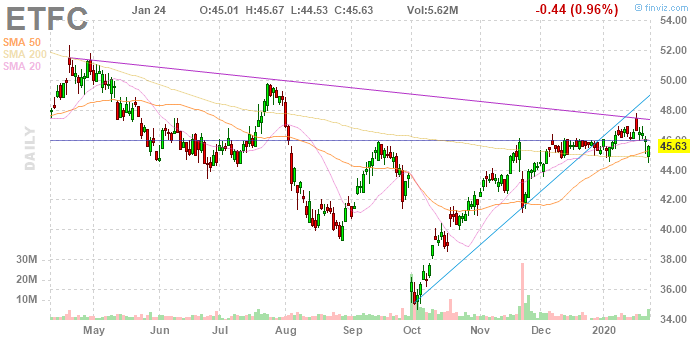
E*TRADE Financial (NASDAQ:ETFC) filled the gap created when Charles Schwab (NYSE:SCHW) cut commissions to zero last year. But as the third of our stock charts shows, resistance has held since, and there’s now some reason for worry:
- Resistance at $46 has been stiff going back to the spring. And the worry right now is whether ETFC stock has any catalysts left. Mixed fourth quarter earnings last week weren’t enough to drive optimism. ETFC did see a golden cross this month, but with volume thin that indicator doesn’t appear as strong as usual. There simply isn’t much on the chart to suggest upside ahead.
- ETFC is cheap — but it might well be cheap for good reason. The merger of Schwab and TD Ameritrade (NASDAQ:AMTD) creates an even more fearsome competitor. Lower interest rates have pressured big bank stocks in early 2020 and suggest lower net interest margin for the likes of E*TRADE and Schwab. This has been a sector that’s been notably weak in recent years, and a group that could have another leg down.
- Patient investors admittedly might see ETFC stock quite differently, given a sub-13x forward P/E multiple. But from a near-term standpoint, it’s quite clear that the stock will struggle to manage a market-wide decline. If U.S. equities roll over, ETFC likely does as well.
As of this writing, Vince Martin has no positions in any securities mentioned.