“Recession” is back in the headlines … what we can learn from looking at the yield curve … history says “watch out” … a laundry list of warning signs looking forward
“The most likely outcome is that the economy will move forward toward a soft landing.”
That comes from U.S. Secretary of the Treasury Janet Yellen.
Oh, but wait – there’s a plot twist…
Yellen said this about the economy back when she was the San Francisco Fed President in the 2000s.
But there’s one more switcheroo that would make even M. Night Shyamalan jealous…
Yellen made this statement in October 2007, just two months before the financial crisis that nearly destroyed the global economy.
Fast-forward to about one month ago when Yellen said she’s “feeling very good” about the chances for a soft landing.
That puts us on track for a meltdown by Thanksgiving!
How is it that just a handful of months ago, economists and analysts across the board reversed their prior predictions for a recession and were calling for a soft landing…
…Yet here we are today with economic/market red flags popping up all over the place, and a “soft landing” suddenly appears to be the longshot, as today’s Wall Street Journal headline illustrates:
Bond Selloff Threatens Hopes for Economy’s Soft Landing
Here’s Bloomberg’s answer:
…Economists find it so difficult to anticipate recessions [because of] … the way forecasting works.
It typically assumes that what happens next in the economy will be some kind of extension of what’s already happened — a linear process, in the jargon.
But recessions are non-linear events. The human mind isn’t good at thinking about them.
Here’s Bloomberg’s eventual takeaway:
The bottom line: history, and data, suggest the consensus has gotten a little too complacent — just as it did before every US downturn of the past four decades.
Here in the Digest, we’ve been happy to trade the bullishness higher this year. But we’ve remained skeptical of the soft-landing narrative.
For us, the question hasn’t been whether there’s more economic and market pain ahead. It’s been how long until it eventually arrives.
Well, the latest movements in the yield curve suggests the bond market believes trouble is closer than ever.
What is the de-inversion of the yield curve telling us today?
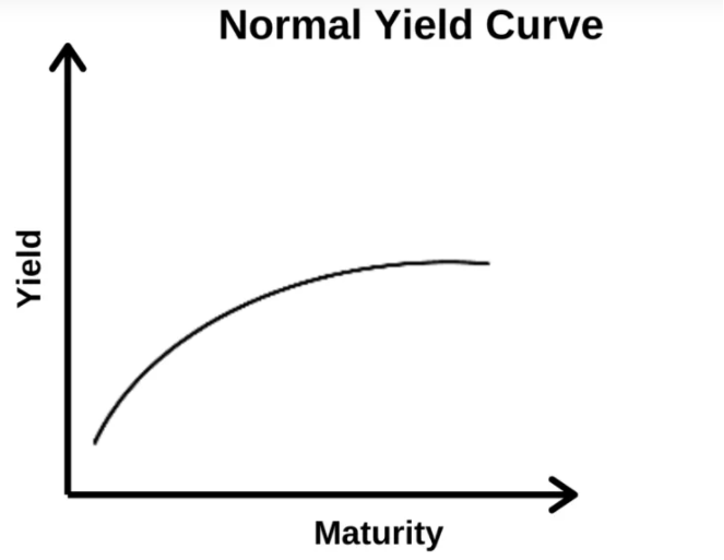
To make sure we’re all on the same page, a yield curve is a graphical representation of the yields of all currently available bonds, from short-term to long-term.
In normal times, the longer you tie up your money in a bond, the higher the yield you would demand for it. So, you’d expect less yield from a two-year bond and more yield from a 10-year bond.
Given this, in healthy market conditions, we usually see a “lower-left” to “upper-right” yield curve.
But when economic conditions become murky and investors aren’t sure what’s on the way, the yield curve tends to flatten.
And if the curve inverts, history has shown that it is a highly accurate predictor of recessions, though the timing of those recessions is varied. Studies show an inversion has happened 6-24 months before a recession begins.

From Reuters:
Yield curve inversion is a classic signal of a looming recession.
The U.S. curve has inverted before each recession in the past 50 years. It offered a false signal just once in that time.
The most widely watched yield curve inversion involves the 10-year treasury yield and the two-year bill
We can analyze this relationship through what’s called the “10-2 Spread.”
As you can see below, the 10-2 spread has been negative since July of last year (meaning an inverted yield curve). And this past July, the spread reached -108.30 basis points, which its deepest inversion since 1981.

Now, your eye might have drifted toward the latest reading of -0.43%. This is the yield curve de-inverting as it climbs back toward zero.
So, what does that mean? Is it good or bad?
Here’s CNBC:
More than a year after a key part of the so-called Treasury yield curve inverted, it has recently started to steepen, a sequence that many pros on Wall Street still believe could be the true sign of economic trouble ahead…
Some say the tale-tell sign that a downturn is imminent is when the curve begins to revert back to its proper form, just as what it’s doing right now.
Whether this steepening foretells economic trouble or not, there’s certainly a relationship between its presence and general economic chaos.
If you look again at the chart above, you’ll see there was a steep normalization back in March. You’ll recall that this is precisely when a handful of regional banks were rolling over, sparking concerns about the health of the sector.
We’ll stop short of predicting an imminent recession based on today’s 10-2 steepening. But let’s look at what history shows us.
Below we look at yield curve normalizations and recessions
Using data from the Federal Reserve, let’s go back to the mid-70s and look at the timing of when inverted yield curves normalized and ensuing recessions.
In the chart below, we have the 10-2 spread. We also have recessions that are marked by shaded areas.
We’ve added a black dotted line to the 0% level to help you see inversions more clearly.
Note that this normalization of an inverted yield curve has preceded each recession except those in the early 1980s when the recessions began during the inversions.
(We’re ignoring the 2020 recession because there wasn’t a sustained yield curve inversion.)
As you can see, since the mid-1970s, there is no example of an inverted yield curve normalizing that did not result in a recession.
To be clear, today’s normalization trend doesn’t mean an impending recession. In most of these past periods, there’s at least a year between when an inverted yield curve begins normalizing and the start of a recession.
But we can say that if history repeats itself, and if today’s yield curve is re-inverting (rather than temporarily pushing higher as it did in March), then the recession countdown has begun.
If we do get a recession, perhaps it will come later this time around. After all, we still have a robust work force. And as my fellow Digest -writer and our Editor-in-chief Luis Hernandez has pointed out, it’s hard to have a recession when everyone has a job.
But history shows that low unemployment numbers can change very fast. Look at the unemployment rate dating back to 1980.
As you can see, the line tends to jump very quickly.
Plus, consider what’s ahead for the economy and U.S. consumer today
First, there’s the United Auto Workers strike affecting 25,000 workers. As we noted in yesterday’s Digest with the help of Louis Navellier, this strike is snarling supply chains. It’s already cost the auto industry about $3.9 billion.
The longer the strike lasts, the harder it will be for these supply chains and the economy to normalize afterward. As the pandemic showed us, you don’t just flip a switch and everything goes back to normal.
Here’s Bloomberg on this:
The industry’s long supply chains means stoppages can have an outsize impact. In 1998, a 54-day strike of 9,200 workers at GM triggered a 150,000 drop in employment.
Next, there’s the resumption of student loans.
After a three-and-a-half-year pause, millions of Americans are now having to resume student loans payments. The timing couldn’t be worse.
As of August – even before this resumption of student loan payments – LendingClub reported that 60% of Americans were living paycheck to paycheck. But now, 45 million Americans carrying student debt will owe an average of $393 per month more.
Back in May, Bloomberg reported that half of all U.S. consumers didn’t have the cash on hand to cover a surprise $400 bill. Well – surprise – you now have an extra $400 bill every month!
Here’s Yahoo! Finance:
[The investment banking and capital markets firm Jefferies] believes many households will scale back spending in order to contend with this “student loan cliff,” which could potentially impact the economy too.
Next, there are surging oil prices.
Though the price of West Texas Intermediate Crude is down to $87 as I write after having topped $93 last week, this price is plenty high enough to hurt consumers at the pump.
Here in Los Angeles where I live, gas prices are already nosebleed high. My friend with an SUV just filled up his tank for almost $200.
Then, we have mortgage rates that are going to obliterate anyone with a variable component to their loan.
Here’s CNBC yesterday:
The average rate on the popular 30-year fixed mortgage rose to 7.72% on Tuesday, according to Mortgage News Daily…
The current trend appears to be even higher, with the possibility of rates crossing over 8%.
And finally, let’s not forget your consumer borrowing costs.
The average annual percentage yield for a credit card continues surging – it’s now up to 24.45% for a new card.
Remember this is the average. LendingTree reports “we’ve seen an enormous spike in the number of cards with maximum APRs of 29.99% or higher as the Fed has raised rates.”
In fact, more than one in three cards that LendingTree reviews now charge 29.99% or more.
And guess what – despite this awful statistic, the American credit card borrower just set a record. Here’s Yahoo! Finance:
The share of Americans rolling their credit card debt from month-to-month is for the first time higher than the portion who pay their bill in full, according to a new survey.
J.D. Power found that 51% of Americans can’t pay off their entire balance each month and instead let it revolve to the next month, accruing interest…
Why does all this matter to you?
Because it ties back to your portfolio through corporate earnings.
If the economy and U.S. consumer is truly headed for a recession, that means wallets will be closing.
When wallets close, corporate bottom lines suffer, and stock prices pull back.
Unfortunately, as we’ve noted here in the Digest, stock prices have surged this year without any earnings growth.
As an analog, if the market is about to belly-flop, we’re standing atop a much higher diving board than we were on in January.
Bottom line: The historical markers of a recession are firing off today. Yes, there’s the possibility we could avoid it. But make sure you draw a distinction between “possibility” and “probability,” and have a plan for your portfolio both ways.
We’ll keep you updated.
Have a good evening,
Jeff Remsburg