


Yesterday, the January CPI report came in hotter than expected. Throughout 2022, whenever a CPI report came in hot, stocks crashed in response. Yesterday, though, stocks didn’t crash. They were just flat. In fact, tech stocks rallied yesterday, and as of this writing, they’re rallying again today.
This counterintuitive price action has many people very confused. Everyone thought a hot CPI report would kill the early 2023 stock market rally. It didn’t. It appears to have only strengthened it.
Why?
Because while the headline January CPI numbers were hot, the underlying contents of the report were decidedly not. In fact, when we looked deeper into the data, we found nearly irrefutable evidence that inflation is dying and will fall off a cliff over the next 12 months.
And by extension, we found nearly irrefutable evidence that a new bull market is forming in stocks.
Core Inflation Data Is Key
Follow me here.
The Fed really only cares about core inflation, which is inflation less food and energy. That’s because the central bank’s monetary policy does not impact the demand for food or energy. (Regardless of how high interest rates go, we all still need to eat and power our homes and cars.)
Core inflation can be segmented into two components: core goods and core services inflation.
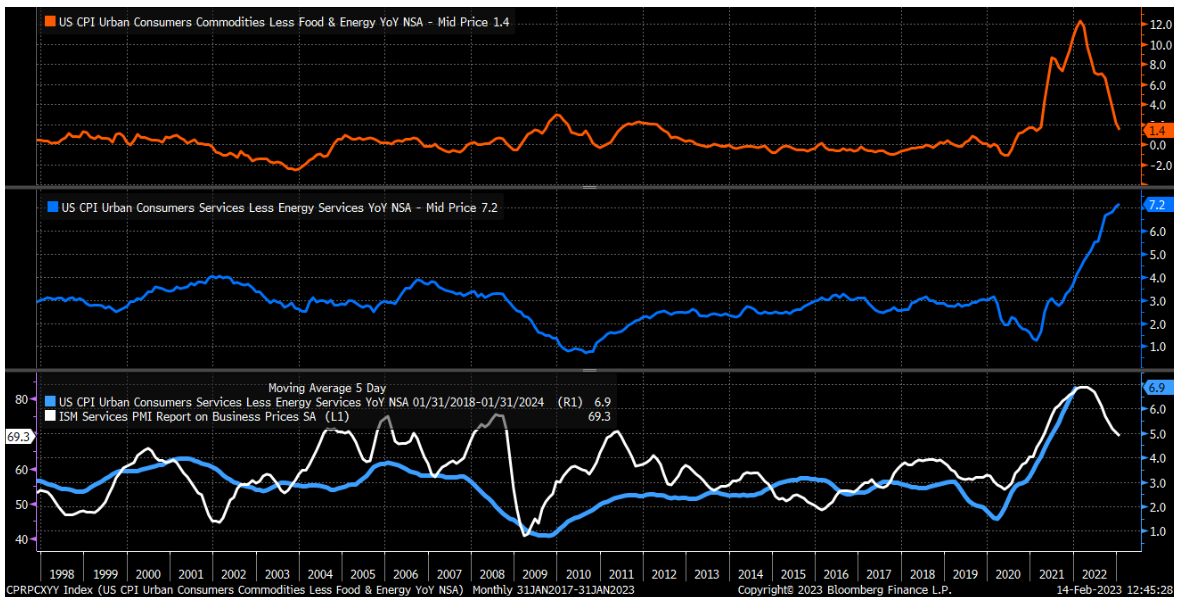
Core goods inflation has been crashing over the past several months. And it continued to crash in January. The core goods inflation rate today is just 1.4%, comfortably below the Fed’s target of 2%.
However, core services inflation has remained stubbornly hot and has actually continued to rise over the past few months. It rose again in January and is north of 7%, way above where the Fed wants to see it.
The hotter-than-expected January CPI numbers were driven by hotter-than-expected core services inflation, not core goods inflation.
That’s important because leading indicators of core services inflation strongly suggest it is peaking right now and will crash over the next 12 months.
More specifically, while core services inflation isn’t falling right now, surveys of service business owners suggest that prices in the industry will drop sharply in 2023.
Over the past 25 years, changes in the Prices Paid Index of the monthly ISM Services PMI reports have led changes in core services by about 12 months. That is, once the trend in the ISM Services Prices Paid index changes direction, core services inflation pretty much always follows suit about 12 months later.
The ISM Services Prices Paid index peaked in December 2021 and really started to roll over in April 2022. It has been plunging ever since.
We are now 13 months from that December 2021 peak and nine months from the April 2022 plunge.
That means we are at peak core services inflation today, and over the next 12 months, those rates should plunge.
Major Disinflation Is Coming
Let’s start to connect dots…
Core goods inflation has already fully normalized to pre-pandemic levels and is actually way below 2%. But that of core services has not. But leading indicators strongly suggest it is peaking right now and will crash over the next 12 months.
Therefore, throughout 2023, already super-low core goods inflation will converge with crashing core services inflation to produce massive disinflation.
We believe the stage is set for inflation to drop to 2% to 3% by the end of this year.
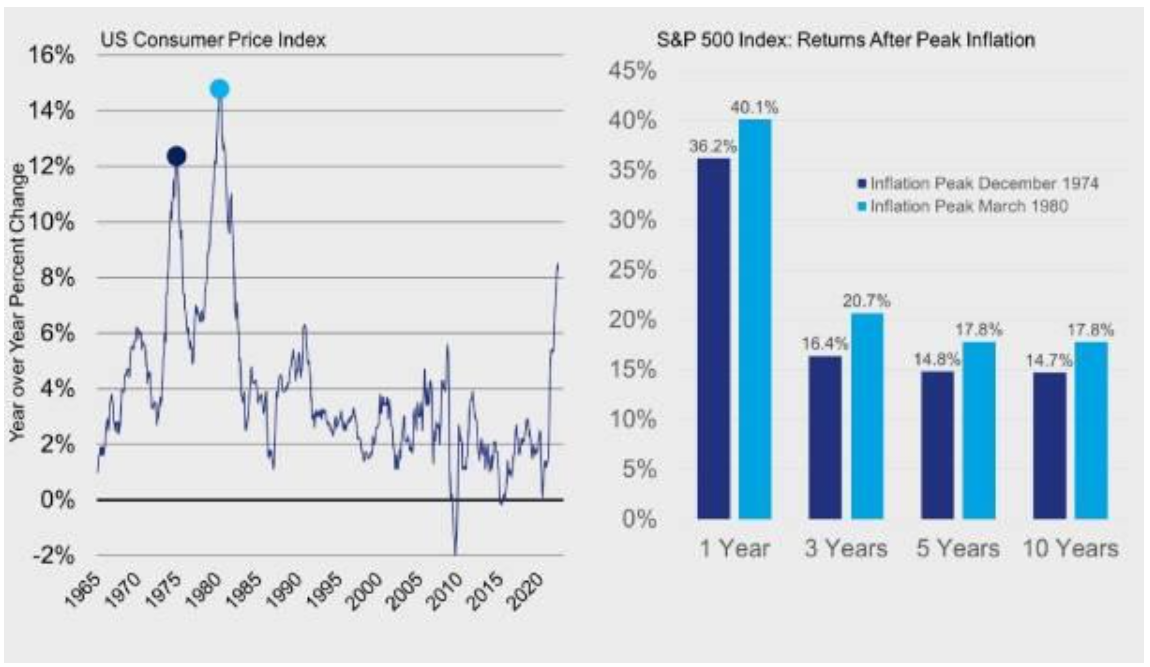
Of course, that is extraordinarily bullish for stocks. Just look at how they tend to perform during massive disinflationary cycles.
Back in 1974/75, stocks soared 36% in the year after inflation peaked. In 1980, they popped more than 40% in the year after it peaked.
The Final Word
Stocks soar after inflation peaks; and it just peaked.
It doesn’t take a rocket scientist to connect those dots. The stock market looks due for a massive boom!
That boom has already begun.
The S&P 500 and Nasdaq are both off to one of their hottest starts to a calendar year ever here in 2023. Our Core Portfolio is up almost 30% in just two months!
Each day you wait to partake in this new bull market is a day you miss out on potentially enormous gains.
Put yourself in a position to start raking in huge returns in the new bull market boom.
On the date of publication, Luke Lango did not have (either directly or indirectly) any positions in the securities mentioned in this article.