


After a red-hot start to the year, the stock market has been sliding lower recently. While some investors may be discouraged by the recent price action – and who can blame them after 2022 – the data says that the recent selloff won’t last much longer.
Indeed, it seems stocks are about to soar over the next three, six, and 12 months!
The data I’m talking about has to do with the market’s 200-day moving average (MA).
Considered the “godfather of all moving averages,” the 200-day is the most widely followed moving average in finance. Investors use it to gauge the long-term price trend of a security.
Typically, when a stock is trading above its 200-day, it’s in an uptrend. When a stock is below the 200-day, it’s in a downtrend.
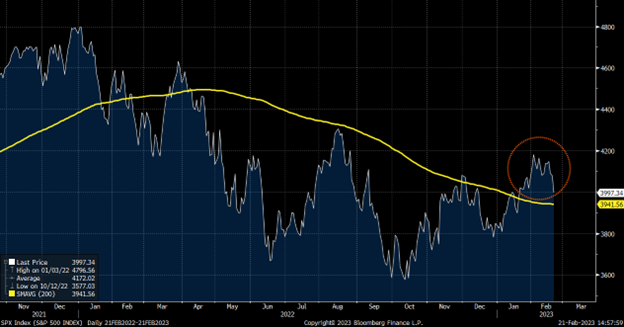
Throughout 2022, the S&P 500 was stuck below its 200-day MA as stocks kept sinking lower. But for the first time in this bear market cycle, the S&P 500 reclaimed its 200-day moving average last month.
Impressive.
More noteworthy, though, is how long the S&P has stayed above this moving average.
The 100% Accurate Stock Indicator
The market crossed above its 200-day on Jan. 20. It has traded above that level ever since. Even amid the recent selling pressure, the S&P has stayed above its 200-day.
That means that stocks have been above the 200-day moving average for 22 straight days. That’s a long time.
Back in the last big bear market – the financial crisis of 2008-09 – the stock market didn’t retake and hold its 200-day for that long until August 2009. And at that point, the market was already in the midst of a big new bull market breakout.

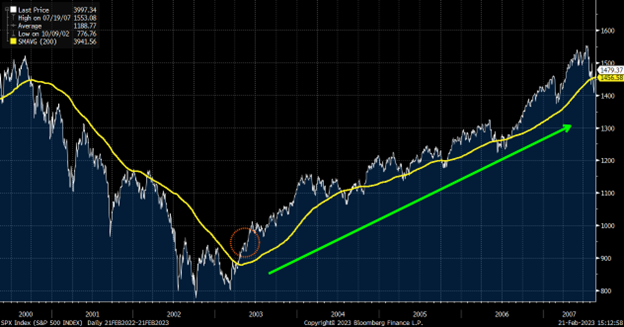
In the bear market before that one – the dot-com crash of 2000-02 – the stock market didn’t retake and hold its 200-day for that long until May 2003. Similarly, that’s when the market was already in the midst of a big new bull market, too.
Lather, rinse, and repeat for the bear market of 1987-88, the one in the early 1980s, and the mid-1970s – every bear market since 1950.
Every bear market of the past 73 years ended when the S&P 500 retook and held its 200-day moving average for at least 18 days.
Whenever this phenomenon has occurred, the market always rallied over the next three, six, and 12 months, with average 12-month returns of about 20%.

In other words, while it may seem like the recent rally is rolling over and we are falling back into a bear market, this stock indicator suggests otherwise.
The Final Word
The fact that the market broke above and held its 200-day moving average for more than 20 days is critical. The stock market has only done that 11 times before. Each time, stocks were higher three, six, and 12 months later.
This stock indicator has 100% accuracy when calling huge rallies.
That’s why we believe the recent stock selloff offers an attractive opportunity to buy the dip before the next leg higher in this new bull market breakout.
Indeed, we just executed a big stock shopping spree for the first time since late 2022. That’s not to overemphasize the importance of short-term movements in stocks, which can often be volatile. Nor is it to suggest the markets cannot be knocked down by a black swan event. However, due to the data and our analyses, we are steadfast in our resolve that this time won’t be different.
Gain access to the stocks we’re adding to our model portfolio.
On the date of publication, Luke Lango did not have (either directly or indirectly) any positions in the securities mentioned in this article.