


Yesterday was a rough day for the stock market. But that still doesn’t change the fact that stocks are in a bullish multi-quarter uptrend.
Nor does it change the fact that a new bull market rally is likely just getting started.
Remember: Stocks don’t go up in straight lines, not even in bull markets. They take two steps forward, one step back, then another two steps forward. That’s just how bull markets work.
And if this really is a new bull market, then yesterday’s selloff is simply creating a great buying opportunity.
We think that is exactly the case.
Yet Another Bullish Indicator Suggestive of a New Bull Market
An important signal here is the stock market’s 200-day moving average.
The 200-day moving average is considered the “gold standard” for the market’s long-term price trend. When it is moving lower, the market’s long-term price trend is negative. When it is sloping higher, the market’s long-term price trend is positive.
Throughout 2022, the S&P 500’s 200-day moving average was sloping downward as stocks kept falling to new lows.
However, the 2023 stock market rally has been so powerful that – for the first time since this bear market started – the S&P 500’s 200-day moving average has turned higher.
It bottomed back in late March and has been pushing steadily higher ever since.
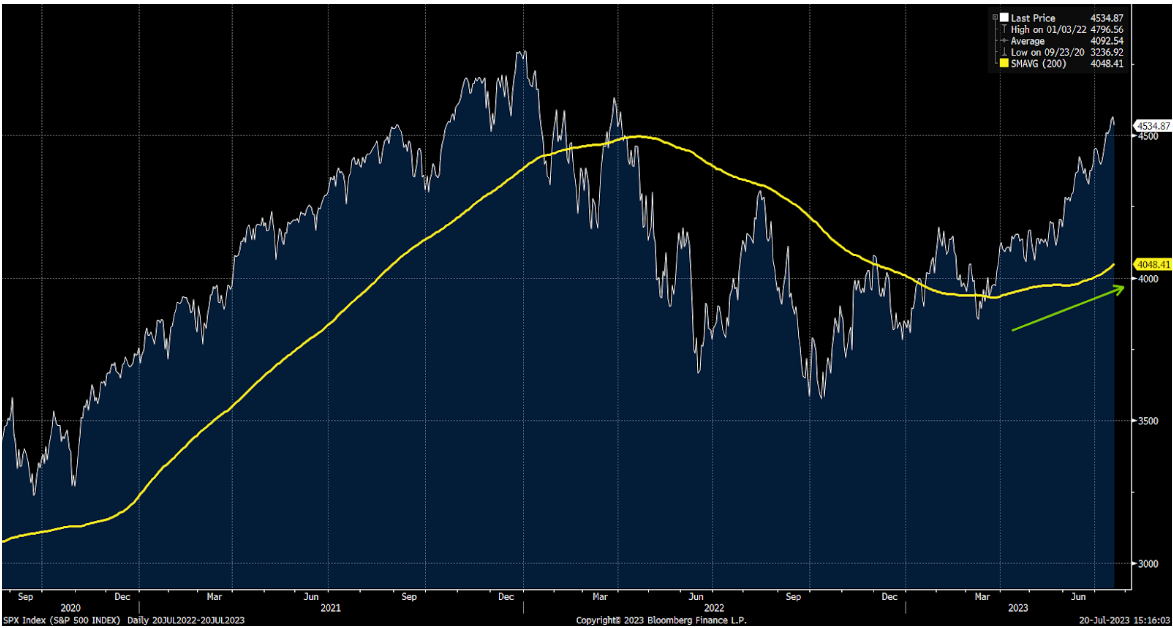
In fact, over the past three months, the market’s 200-day moving average is up more than 2%.
That’s an important number.
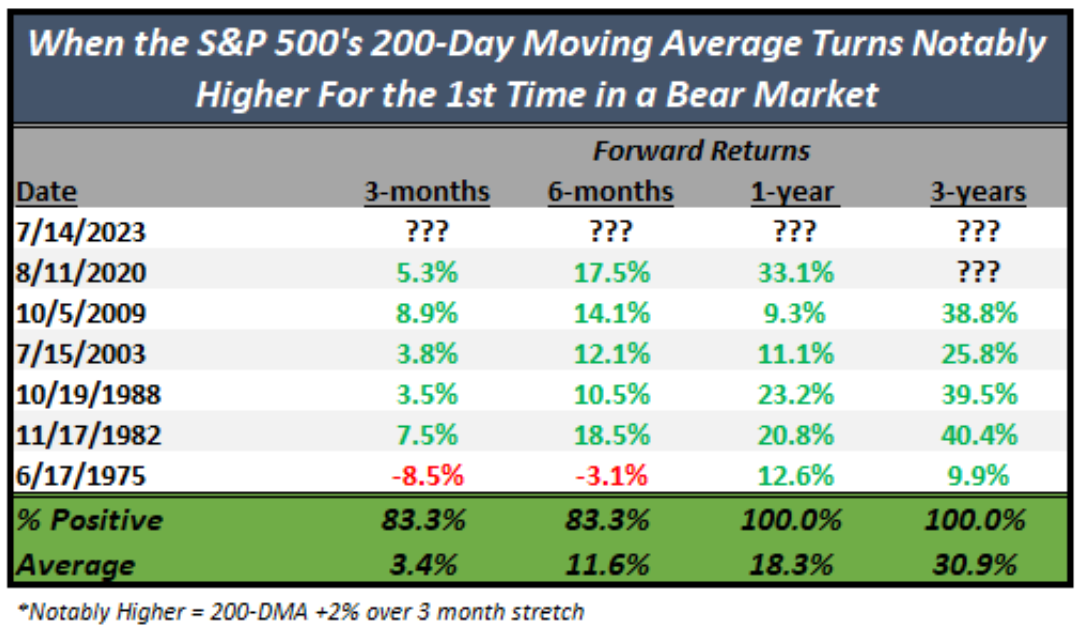
Since 1975, every single bear market ended (and a new bull market began) when the S&P 500’s 200-day moving average turned higher by more than 2% over a three-month period.
More importantly, every time this happened, the stock market was in the early innings of a new multi-year bull market.
In fact, 100% of the time, stocks were higher a year later, with an average return of 18%.
And 100% of the time, stocks were also higher three years later, with an average return of 30%.
History says this stock market rally is just getting started.
And that means yesterday’s selloff is nothing more than a terrific buying opportunity.
Color us bullish.
The Final Word
You could very reasonably argue that ChatGPT – the buzzy AI chatbot that is taking over the world – kickstarted this new bull market rally.
After all, it launched in November 2022, right around when stocks bottomed. And since that time, AI stocks have been the market’s biggest winners.
ChatGPT is this stock market’s “firestarter,” if you will.
And I’ve unearthed a “backdoor” way to invest in ChatGPT.
On the date of publication, Luke Lango did not have (either directly or indirectly) any positions in the securities mentioned in this article.