


Bold proclamation of the day: We think the August stock market selloff just ended, and stocks are about to soar like they did in June and July.
I don’t make claims like that lightly. So, what makes me so confident?
A plethora of very reliable technical indicators.
In short, pretty much every major long-term trend indicator suggests that the August stock market selloff is just a “garden-variety” pullback and nothing more sinister.
Meanwhile, every major short-term trend indicator suggests that if this is just a garden-variety pullback, then it has either already ended or is very close to ending.
Bullish Major Long-Term Stock Indicators
With respect to the long-term trend indicators:
- The S&P 500 remains above its 100-day and 200-day moving averages. And the 50-, 100-, and 200-day moving averages are all still sloping upward. This is entirely consistent with “short-term pullback in a long-term uptrend.” If the primary trend for stocks were changing from positive to negative, the moving averages would be changing direction, too. They simply aren’t doing that today.
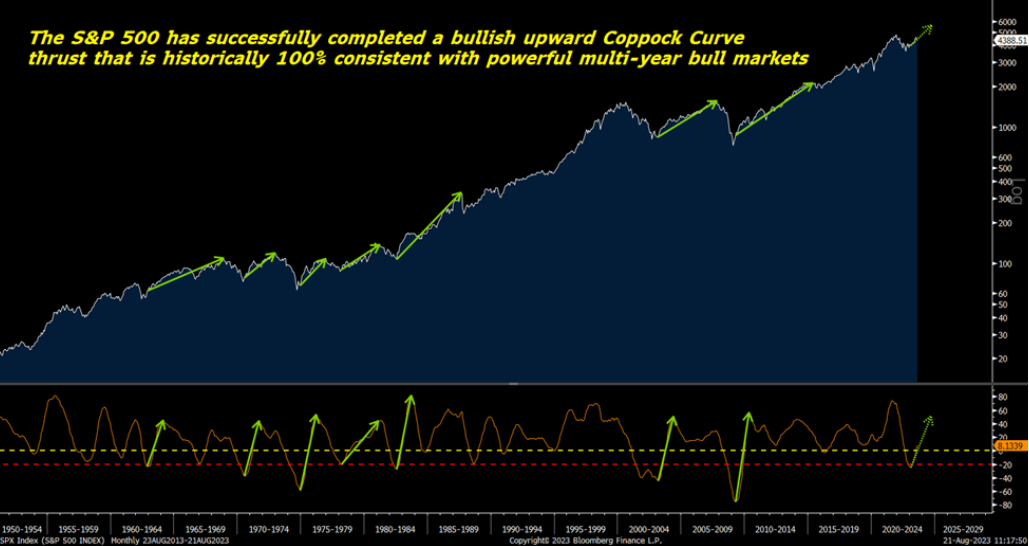
- The monthly Coppock Curve on the S&P 500 is positive and moving higher. Our favorite long-term trend oscillator is the monthly Coppock Curve. And it just turned positive for the first time in this cycle in July after being deeply negative in late 2022. According to data going back to 1950, upward bullish thrusts like this on the monthly Coppock Curve are 100% historically consistent with new multi-year bull markets.
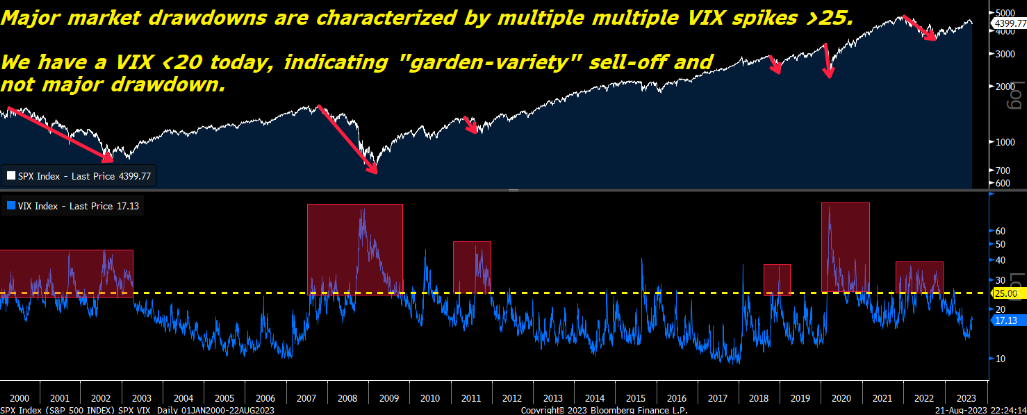
- The volatility index (VIX) remains below 20. Major market drawdowns are always characterized by VIX spikes above 25 and are often characterized by VIX spikes above 30. Currently, the VIX is below 20, indicating that we’re in a garden-variety selloff and not a major market drawdown like the dot-com crash, 2008 financial crisis, COVID crash, or 2022 bear market.
All of those important long-term technical signals are consistent with “garden-variety” selloff in stocks and nothing more sinister. More sinister selloffs would puncture the 200-day moving average, pull the moving averages lower, and result in a VIX spike above 25.
And we aren’t seeing any of that today.
Short-Term Stock Indicators Point to a Bottom
Meanwhile, the market’s most important short-term technical indicators are telling us that if this is indeed just a garden-variety pullback, then we’ve likely hit the bottom.
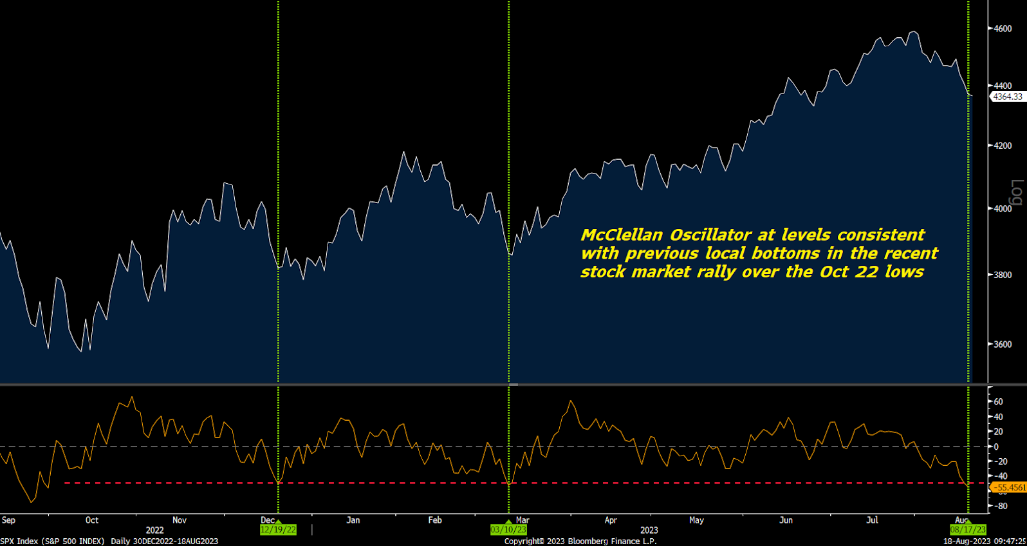
Simply consider the S&P 500’s McClellan Oscillator.
It recently dropped below -50. Since stocks bottomed in October 2022, the McClellan Oscillator has only been this low twice before: December 2022 and March 2023. Of course, during those months, stocks were in the midst of pretty big selloffs. But in those selloffs, when the McClellan Oscillator dropped below -50 (like today), stocks bottomed, then bounced back big-time.
In other words, the McClellan Oscillator is telling us that stocks are either at or very close to a major bottom.
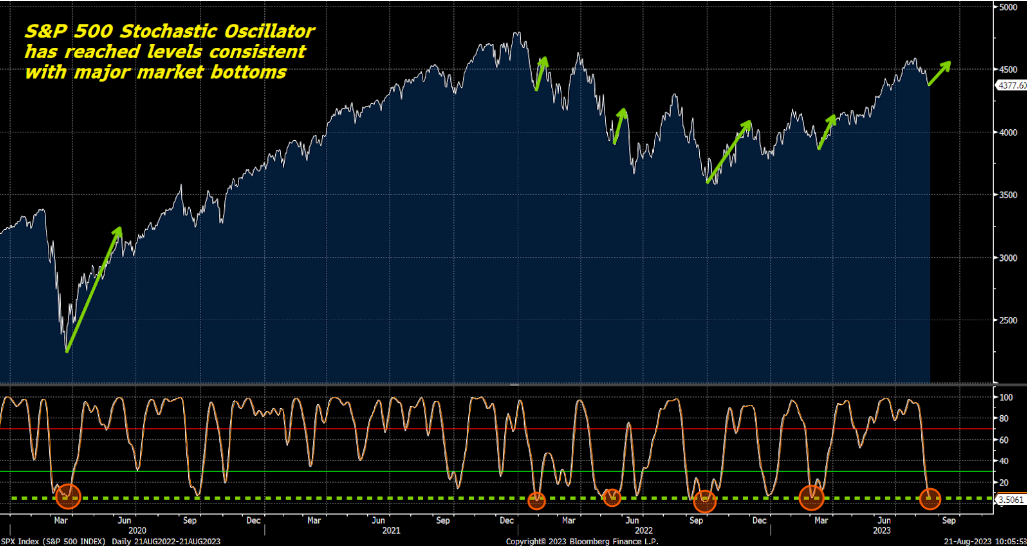
Or how about the Stochastic Oscillator?
That short-term oscillator also recently dropped to super-oversold levels that are consistent with major market bottoms.
Specifically, the S&P 500’s Stochastic Oscillator dropped below 5 last week.
Every time that oscillator has dropped below 5 since the COVID pandemic, stocks bottomed and soared over the next few weeks.
It’s also worth mentioning that the S&P 500’s relative strength index (RSI) dropped below 35 and that the market broke below its lower Bollinger Band.
The last two times the market did those things? Yep, at the bottoms of the selloffs in December and March.
In other words, all the major short-term technical stock indicators out there are saying the same thing. If this is just a garden-variety selloff, then it is most likely over. And stocks should rebound from here.
The Final Word
Are you ready for that rebound?
If not, let’s get you prepared.
I’m sure you’ve heard of ChatGPT, the AI chatbot that has taken the world by storm. The company behind ChatGPT is a firm named OpenAI, and I think it’s on track to one day become the biggest company in the world.
But OpenAI is not a public company. They don’t have a stock. And most folks have no idea how to invest in this promising startup.
But I’ve discovered a ‘loophole’ to allow you to plug into the heart of the AI Boom and take your very own stake in ChatGPT.
On the date of publication, Luke Lango did not have (either directly or indirectly) any positions in the securities mentioned in this article.