

As we’ve talked about in recent weeks, the Fed recently conveyed some incredible news: It’s near the end of its current rate hiking cycle.
At the March Federal Open Market Committee (FOMC) meeting, the Fed hiked rates by 25 basis points and provided a dovish statement – excluding the previous phrase of “ongoing” rate increases and added “some additional” policy firming by be needed.
But the Fed’s job isn’t done just yet. Now it needs to un-invert the yield curve.
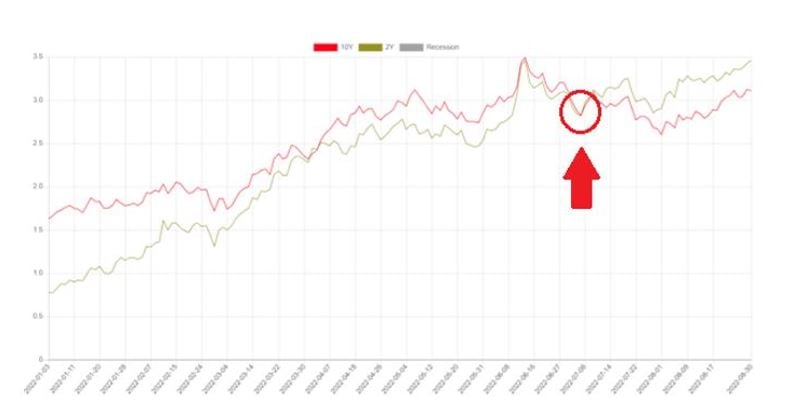
An inverted yield curve is when the two-year Treasury yield is above the 10-year Treasury yield. The yield curve first inverted on April 1, 2022. It briefly reverted back to a normal curve, but reinverted again in July.
The good news is the curve is a lot less inverted today than it was not that long ago. In early March 2023, the two-year Treasury yield was at %, while the 10-year Treasury yield was at 3.968%. As of this writing, the two-year Treasury bond is at 3.77% and the 10-year Treasury bond is at 3.29%.
There are two steps the Fed needs to take to un-invert the yield curve. The first step is to stop raising key interest rates, which it signaled at the March FOMC meeting.
The second step has to do with its open market operations. As I recently stated on CNBC:
[The Fed] should start with their open market operations and get the short-term part of the curve down… When they say they’re going to do some open market action, right now they’re draining liquidity. They don’t tell you where in the curve they’re doing to be doing that … In their open market action, they have to shift it to the short part of the curve. And they have to try to push the yield curve down.
The reality is it is very important that the yield curve is un-inverted, and in today’s Market 360, I’ll explain why. But first, let’s discuss what exactly a Treasury yield is…
What Is a Treasury Yield?
Treasury yields are basically the interest you earn when you own U.S. Treasury bills, notes, bonds or inflation-protected securities. The U.S. Department of Treasury sells these securities as a way to pay for the U.S. debt.
The first thing to know about bond yields is that they move inversely to bond prices, just like a dividend stock. If the price of the bond goes down, you are earning a higher rate of return because you paid less. The opposite is true when bond prices go up. So, whenever you see the yield rise, the price of the bond is falling.
The second thing to know is that Treasury prices fluctuate with supply and demand. Treasury bonds are sold at auction initially, but they can also be bought and sold in the secondary market after they are issued. If there is a lot of demand, the bond will sell for a price above face value, which then lowers the yield. On the other side, if there is less demand, then the price of the bond will be lower and the yield will rise. At maturity, the government will pay back the face value of the security with interest.
Because Treasury bills are backed by the U.S. government, people view them as very secure. That’s why demand for Treasury bonds goes up (and consequently forces yields down) in times of economic uncertainty.
Securities with a long-time horizon often have the highest interest rates. Investors demand a higher return if they have to wait longer until maturity. This gets us to what’s called the “yield curve,” which you have probably heard a lot about this year because it is one of the most-watched indicators when it comes to signaling recessions.
What Is an Inverted Yield Curve?
The yield curve refers to the relationship between short-term yields and long-term interest yields. Long-term bonds pay a higher yield than short-term bonds in a normal market. You can see a normal yield curve in the chart below, created by my InvestorPlace colleagues John Jagerson and Wade Hansen for their Strategic Trader readers. The black line is the long-term yield (10 year), and the red line shows the short-term yield (two year).
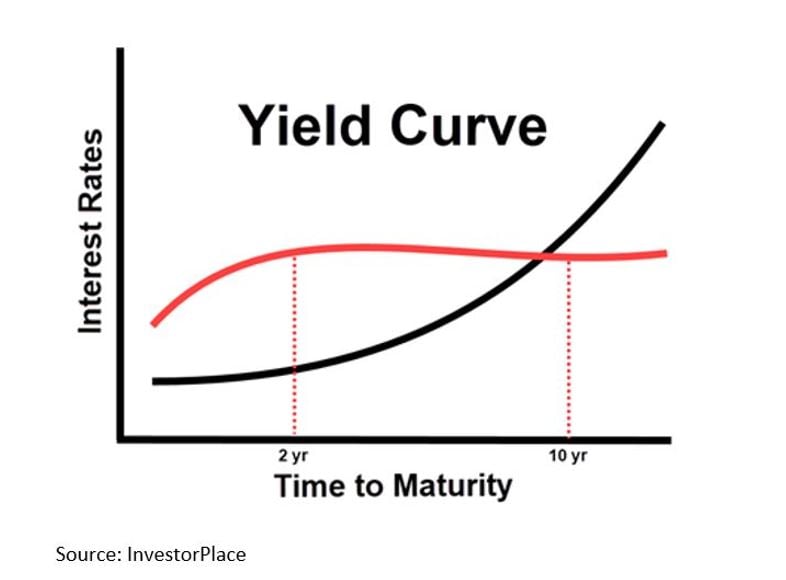
The yield curve “flattens” when long-term and short-term rates are about the same. However, it “inverts” when short-term yields rise above long-term yields. As I mentioned before, the two-year Treasury bond is currently higher than the 10-year Treasury bond – so the curve remains inverted today.
So, what are the yields telling us now?
An Inverted Treasury Yield Curve Is Bad News for the Economy
An inverted yield curve has served as a precursor for a recession in the past. In fact, since 1956, every recession was preceded by an inverted yield curve. The folks at Bespoke noted that when the two-year and 10-year Treasury yield curve invert there’s a more than 67% probability that the U.S. will fall into recession in 12 months and a more than 98% probability that a recession will occur in the next two years.
According to Bloomberg, the last persistent inversion of the Treasury yield curve occurred in 2006-2007 ahead of the 2008 recession.
As long as the yield curve remains inverted, we’re going to continue to have banking issues. And if there’s any failure in the banking system, it hurts all banks. This, then, hurts commerce, innovation, and something called the “velocity of money,” which is the measured rate at which money is exchanged in an economy.
The bottom line: An inverted Treasury yield curve has a considerable effect on the markets and the overall economy. This is why it’s critical the Fed does the right thing and finishes un-inverting the yield curve.
Now, as investors, the question becomes: How do we profit in an uncertain economic environment?
The key is knowing where to put your money.
Essentially, we are essentially entering a funnel where money is diverted to stocks with the strongest forecasted earnings growth – and fewer stocks will lead the overall market higher.
In this environment, it remains imperative that we control our own destiny by investing in fundamentally superior stocks that are impervious to economic cycles.
It’s for this reason that I remain laser-focused on fundamentally superior stocks, as these are the ones that should break out as new market leaders in the coming months. In fact, in last Friday’s Growth Investor Monthly Issue for April, I recommended five new fundamentally superior stocks. All five are uniquely positioned to prosper in their respective corners of the market and are backed by superior earnings and sales growth.
If you’d like the names of my latest recommendations, simply click here to become a member of Growth Investor today. Once you do, you’ll have full access to my latest Monthly Issues, Weekly Updates, Special Market Podcasts and much more!
Click here to learn more and join me at Growth Investor today.
Sincerely,
Louis Navellier