So far, earnings season hasn’t been all that exciting. But it has at least been positive — mostly. The S&P 500 has ground roughly 1.3% higher in the last nine sessions; the Nasdaq Composite has gained 1.5%. But the Dow Jones Industrial Average actually declined, thanks in part to weakness at components McDonald’s (NYSE:MCD) and Boeing (NYSE:BA).

Of course, relatively placid overall trading, including a 0.19% increase in the S&P 500 on Thursday, includes some significant moves. Biogen (NASDAQ:BIIB) soared on Tuesday thanks to solid earnings and, more importantly, progress with an Alzheimer’s treatment. Twitter (NYSE:TWTR) tanked on Thursday thanks to a huge whiff on ad revenue, two days after fellow social media play Snap (NYSE:SNAP) did the same.
But Friday’s three big stock charts highlight companies where the news hasn’t been quite as significant, nor the moves quite as big. In all three cases, movement ahead is likely; the question is in which direction. In that way these big stock charts mirror the broad market, which means they may give some clues as to where still-choppy trading in U.S. equities is heading.
Microsoft (MSFT)
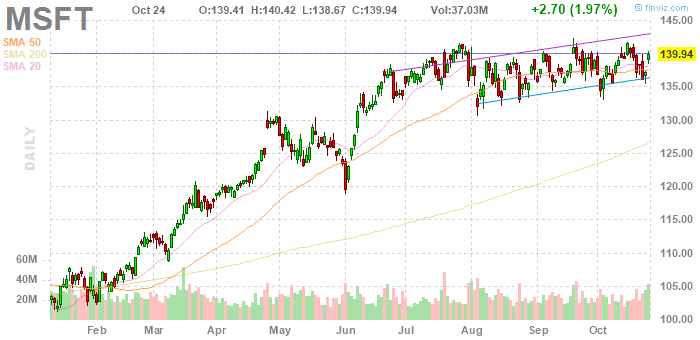
For three months now, Microsoft (NASDAQ:
MSFT) has been stuck in a narrow range. Not even yet another hugely impressive earnings report this week could change investors’ minds. At some point, MSFT stock will make its move, but the question in the first of our three big stock charts is in which direction:
- At the moment, the chart seems modestly bullish, as MSFT has established an uptrend since early August. Of course, investors could also go back to late July, and see resistance as holding repeatedly around $141. With 20-day and 50-day moving averages running right through the middle of the channel, the chart certainly seems like it’s in the eye of the beholder.
- Fundamental analysis seems to lead to a similar conclusion. Wall Street does see upside: the average price target for MSFT is $157, about 12% above current levels. But it’s not as if Microsoft stock is cheap, at roughly 25x FY20 consensus earnings estimates even backing out net cash. This undoubtedly is a wonderful business, but it’s certainly priced as such.
- With a market cap now over $1 trillion, MSFT stock can move market indices on its own. But it might be the market that winds up moving MSFT stock at this point. If investors are willing to keep paying mid-20s earnings multiples for quality, the rally can continue. But as seen in July, even Microsoft stock is vulnerable if this earnings season, too, leads to market-wide pressure.
Texas Instruments (TXN)
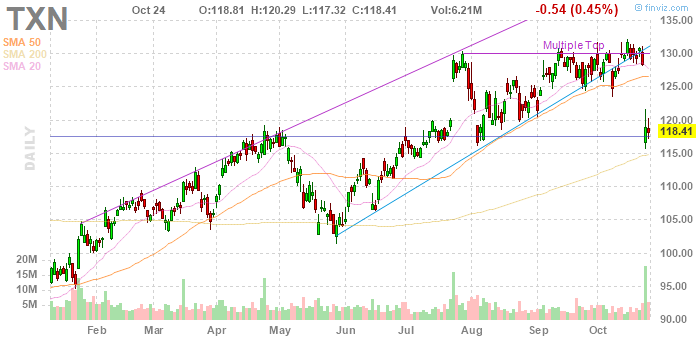
Texas Instruments (NASDAQ:TXN) tumbled 7.5% on Wednesday after soft guidance given with its earnings report on Tuesday afternoon. As a result, the second of our big stock charts seems almost textbook from a technical perspective:
- TXN moved higher in a solid channel, bouncing off moving averages repeatedly. A multiple top at $130, however, signaled risk ahead, as it often does. Now $118, a former resistance level, has turned to support, at least for now.
- That analysis would seem to suggest that TXN is an attractive “buy the dip” candidate, and one with the potential to fill the gap over time. But on this site, Serge Berger made a different case, arguing that the move below near-term moving averages suggested more downside ahead.
- I’d still lean toward the bullish side, and reports elsewhere in the sector add to the fundamental case. Intel (NASDAQ:INTC) jumped nicely after an earnings beat on Thursday afternoon. Supplier Lam Research (NASDAQ:LRCX) soared after a solid report of its own, and it and rival Applied Materials (NASDAQ:AMAT) proved to be canaries in the coal mine ahead of last year’s sell-off. As a result, Texas Instruments’ guidance looks like an outlier in the sector, and thus not necessarily a sign that business is headed for a sudden downturn. That interpretation adds to the sense from the chart that support will hold here, and that a bounce could be on the way.
Box (BOX)
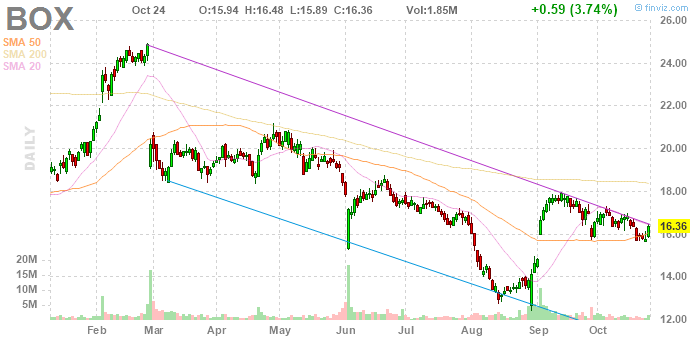
The big news for Box (NYSE:BOX) on Thursday didn’t come from earnings. Rather, strong commentary from major shareholder Starboard Value spiked the stock. Starboard CEO Jeff Smith said at a conference that Box was “very, very attractive and could be acquired.”
Starboard’s initial stake helped drive the stock off an August bottom, which represented the stock’s lowest levels in almost three years. Thursday’s bounce puts BOX in an interesting spot technically:
- BOX is aiming to break out of its downtrend and already has moved past 20- and 50-day moving averages. That’s a combination that suggests a potential breakout could be on the way.
- Fundamentally, the case gets a bit dicier. Box is an intriguing acquisition target, with the likes of Oracle (NYSE:ORCL) and Adobe (NASDAQ:ADBE) as logical buyers, according to Starboard. But at 70x forward earnings, it’s hardly cheap. And it’s trying to pivot to a more storage-focused model while competing with giants like Microsoft and Alphabet (NASDAQ:GOOG,NASDAQ:GOOGL), to name just two.
- That said, investing alongside Starboard certainly seems to make some sense. And the chart suggests some near-term upside. Add to that some help from the broad market — namely a bounce for growth stocks more broadly — and BOX could have a nice rally ahead.
As of this writing, Vince Martin has no positions in any securities mentioned.