Does the market being at an all-time high hurt the chances for more Santa gains? … a clue from the latest consumer spending data … fun Santa Claus Rally trivia
Are we being greedy to expect a Santa Claus Rally when the S&P is already sitting at its all-time high (and up a whopping 25% so far this year)?

Interestingly, it turns out that most people use the term “Santa Claus Rally” in a way that’s different than its original intended meaning. So, before we even answer our question, we should clarify what we’re talking about when we use the term “Santa Claus Rally.”
Fortunately, our technical experts, John Jagerson and Wade Hansen, did this for us in their latest Strategic Trader update. The issue offers some great market history, plus it pulls back the curtain on how two world-class traders are viewing the odds of fresh all-time highs as we head into the holidays.
Today, let’s look into John and Wade’s update for clues about whether Santa will be bringing a rally this year or not.
***The modern definition of Santa Claus Rally versus the historical definition
For newer readers, John and Wade are the analysts behind Strategic Trader. This premier trading service combines options, insightful technical and fundamental analysis, and market history to trade the markets, whether they’re up, down, or sideways.
In Wednesday’s update they began by pointing out the shifting definition of “Santa Claus Rally.” From their update:
The term was first coined by market analyst Yale Hirsch in 1972’s The Stock Trader’s Almanac. As originally defined, a Santa Claus Rally could occur during the period of time spanning the last five trading days of the old year and the first two trading days of the new year.
The performance of the market during these trading days is used by almanac traders as an indicator of how well the market is likely to do the next year.
According to Jeff Hirsch (Yale’s son), a strong performance during this period can be a good sign for the market, but “If Santa Claus should fail to call, bears may come to Broad and Wall” – the location of the New York Stock Exchange.
However, since 1972, many analysts and commentators have been using the term “Santa Claus Rally” to cover the period of time from the beginning of December – or even as early as “Black Friday” – until Christmas.
John and Wade clarify that they’ll be using the modern definition.
For one, it’s a stretch to believe that watching seven trading days can provide accurate insights into market performance for an entire year. Second, the consumer buying effect on corporate bottom lines is typically felt before Christmas, not after.
With that definitional clarification out of the way, let’s get back to the question at hand.
From John and Wade:
The short answer to the question “Can Santa still rally the market?” is yes.
***Making the case for a Santa Claus Rally
In diving into the justification for their answer, John and Wade start by taking a look at the chain reaction that typically leads to a Santa Claus Rally. And this means evaluating one important variable we looked at earlier this week here in the Digest…
Shoppers.
From John and Wade:
Retail stocks are often the ignition switch that gets the chain reaction started; nearly 70% of the gross domestic product (GDP) in the United States is driven by consumers.
If consumers are confident in their financial future, they tend to spend more. The opposite is true if they’re concerned about their finances.
At no time is this more apparent than during the holiday shopping season.
Retailers make the majority of their yearly profits during the holiday season. So, if shoppers are out in droves, padding corporate bottom lines, it often drives up retailer stock prices.
This tends to have a domino effect as businesses in other sectors interpret the buying as “strong economic growth.” That usually results in rising stock prices in these adjacent sectors based on the expectation of strong GDP numbers.
And there you have it – the Santa Claus Rally.
***Given retailer health as the initial domino in this sequence, John and Wade zero in on the latest data reflecting the health of the consumer
Back to John and Wade:
We received good news on this front on Tuesday when the Census Bureau released the latest retail sales numbers.
Analysts were worried sales numbers might drop as inflation has been rising and many store shelves remain empty amid the ongoing supply-chain disruption, but those fears were misplaced.
Retail sales rose by 1.7% in October. This was nearly a full percent higher than the revised 0.8% growth rate the previous month and much higher than the consensus estimate of 1.3%.
These numbers tell us consumers are still willing to spend, which should boost retail stocks.
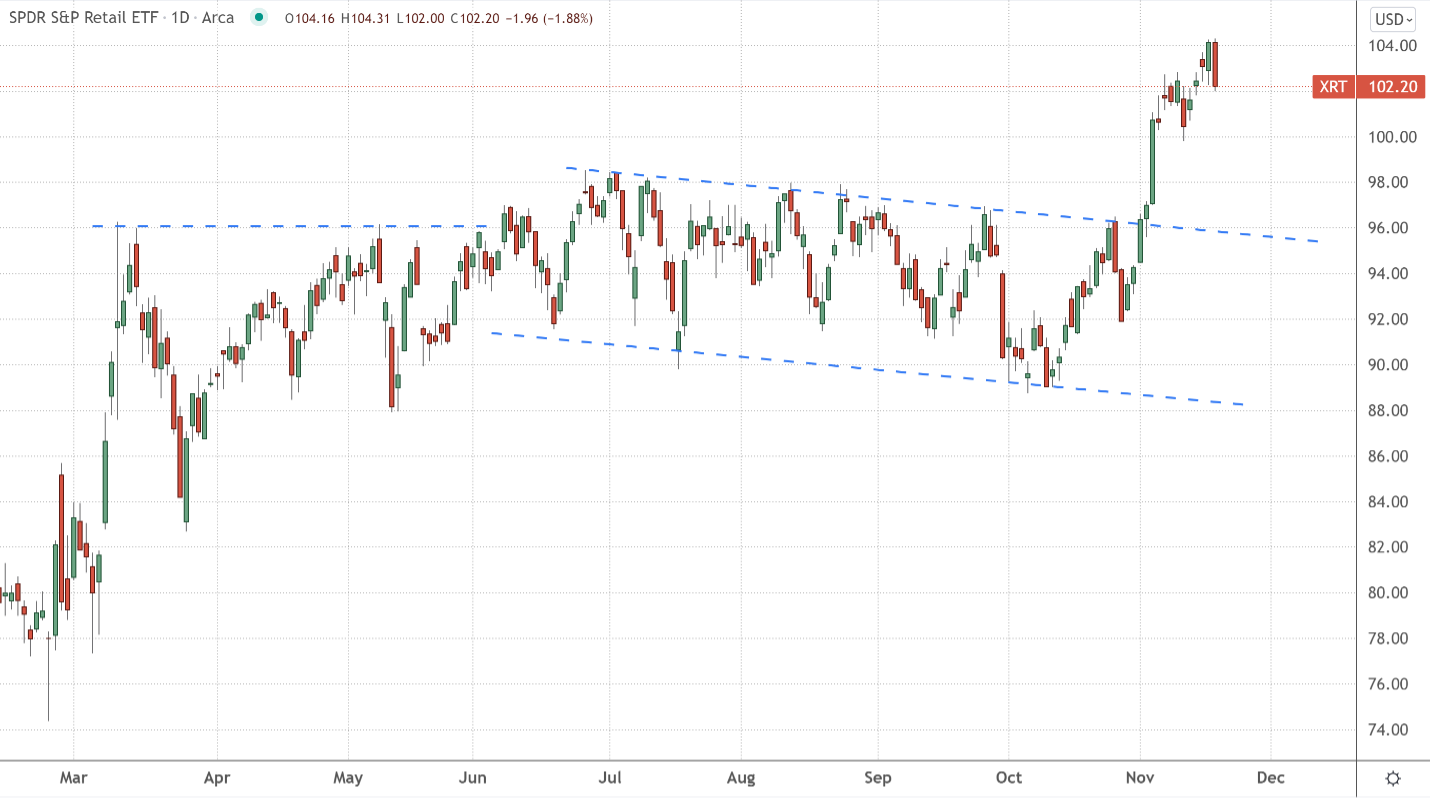
John and Wade simplify their analysis by looking at the SPDR S&P Retail ETF (XRT).
They note that after consolidating for much of the year, XRT just broke higher out of its trading range at the beginning of the month.
Here’s that chart from the Strategic Trader update:
XRT pulled back this week largely due to Target’s (TGT) earnings results. The retail giant actually topped estimates but the stock fell nearly 5% on Wednesday because management decided to absorb some of the higher costs it’s seeing from inflation, rather than pass them on to customers.
Investors worried how these compressed margins will impact future earnings, resulting in the selloff.
Back to John and Wade:
TGT may have reported lower margins, but the company’s CEO expects “a really strong holiday season.”
This should allow not only TGT but also the other stocks within XRT to recover nicely.
I’ll add that we’ve seen strong retail earnings from Home Depot, the parent company of TJ Maxx, Lowe’s, and Walmart (though Walmart got dinged by investors for the same “margin” reason as Target).
***Some fun trivia about the original Santa Claus Rally
If we return to the original definition, meaning the last five trading sessions in December and the first two of January, we find some interesting statistics.
From LPL Financial:
There isn’t a single seven-day combo out of the full year that is more likely to be higher than the 77.9% of the time higher we’ve seen previously during the Santa Claus Rally.
And this is from the 2016 edition of The Stock Trader’s Almanac:
Since 1969, the Santa Claus rally has yielded positive returns in 34 of the past 45 holiday seasons—the last five trading days of the year and the first two trading days after New Year’s.
The average cumulative return over these days is 1.4%, and returns are positive in each of the seven days of the rally, on average.
Short-term trade, anyone?
Returning to the modern definition of Santa Claus Rally, here’s John and Wade to take us out:
The S&P 500 is currently hitting some resistance near its all-time highs, but we would not be surprised at all to see the index break up through this level in the coming weeks.
We’re making adjustments in the Strategic Trader portfolio to take profits off the table as they materialize just in case volatility picks back up, but we’re still bullish.
Let’s see what Santa can do for us this year.
Have a good evening,
Jeff Remsburg