Are we getting pump-faked? … what historical bear markets tell us … do earnings support this bullish leg up? … are inflation and Fed-hikes over? … how to approach this market
Terrence Jones won’t go down as one of the greatest NBA players of all time. But he’ll be remembered for one thing at least…
A mean pump-fake.
For anyone who doesn’t follow basketball, a “pump fake” happens when a player pretends to be starting a jump shot (a pump), causing the defender to leap to challenge it.
Once the defender is committed, the player pulls back the fake and does something else with the ball.
Apparently, Terrence Jones was so good at his pump-fake that even though players knew it was coming, they would fall for it anyway.
From NBA.com:
…opposing NBA teams are well aware that Jones leans heavily on the move. That doesn’t mean they can stop it, even if they don’t try to hide their awareness of his deception. Jones constantly hears defenders reminding each other about it.
You probably can see where this is going, so, let’s just ask the question:
Are increasingly bullish investors falling for a pump-fake right now? Even though history shows us that rallies within a broader bear market are routine?
In yesterday’s Digest, we looked at why a bull market is out on the horizon. In short, the government’s debt load is too enormous to allow interest rates to climb too high. At some point, the Fed will have to return to accommodative monetary policy which will juice the stock market.
But as we noted yesterday, that “horizon” could be many months away. And between now and then, the market could see some painful declines.
So, what’s the case for this recent bullishness being a Terrence-Jones-style pump-fake?
***Looking at the historical data on bull-market rallies within broader bear-market declines
Stocks don’t go straight up. But neither do bear markets go straight down.
And what investors seem to forget – even though it happens nearly every time – is that bear-market rallies can produce enormous gains that paint an “all clear” picture. Unfortunately, this can serve as bait, luring investors into the market, only for the growling bear to return.
So, how bullish can these bearish pump-fakes be?
Below, we look at how they measured up in the 2000-2002 and 2007-2009 bear markets.
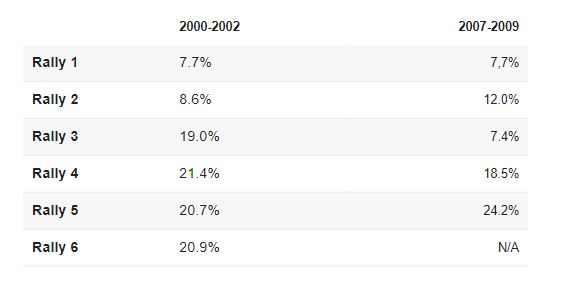
For comparison, this current bear market has had only four rallies so far, one of which is questionable to be considered a rally.
This latest rally that began in June is the strongest to date. It’s clocking in at 13% as I write Thursday morning. March’s rally is the runner-up, measuring about 11%.
But as you can see in the chart above, a 13% gain has nothing on some of those 20%+ rallies.
Forbes looked into this. Here they are, describing their methodology:
If we examine…past bear markets, and exclude the 1987 and 2020 markets which had a V-shaped recovery (2020), or no additional undercuts of first lows (1987), we find five extended S&P 500 bear markets since 1970.
These five averaged about six failed Follow Through Days (FTDs).
We define an FTD as an upward move of 1.7% or greater (historically used 1.2% or greater) in the market, four days or more after a new low on an increase in day-to-day volume.
The takeaway from the Forbes analysis is that the typical failed FTD move has an 11.8% gain over 26 days from the FTD. So, nearly one month of bullish market-action.
***The skeptic will be quick to point out that our current rally began 48 days ago – so: “Is this time different?”
It could be. But based on historical data, this slightly longer bullish jag isn’t unusual.
Back to Forbes:
…There have been 16 bear market rallies after an FTD that lasted an average of 40 days. All returned over 10% and the best, 5 of 16, returned over 20%.
As an example of this, we can go back to the 1973-1974 bear. After falling about 20%, the market rallied 13% over 51 days.
We saw the same thing in 2002.
After shedding 38%, the S&P shot up a blistering 25% over 108 days. It then traded sideways for a few months before the bottom dropped out again.
Looking big-picture, what I’m trying to illustrate with these data is that nothing about our current rally suggests “this time is different.” The numbers are generally in-line with past bear-market rallies.
So, forgetting the historical data, perhaps it will be helpful to look at why we’ve been rallying.
Is something about this latest surge truly unique or different?
Well, it seems this rally boils down to:
- Earnings haven’t been awful
- Hope that the Fed is done with the brunt of the rate-hiking because the worst of inflation is behind us
- And some encouraging economic data
But are we seeing these things clearly?
***How are earnings really coming in?
Coming into this Q2 earnings season, many people were fearing a bloodbath. Fortunately, that hasn’t happened.
But when we look under the hood at earnings, they’re not good. The reality is that record profits from the oil sector are putting lipstick on the pig.
Deutsche Bank AG’s chief strategist Binky Chadha recently commented on this. He said that on a year-on-year basis, S&P 500 earnings are on track to rise by a healthy 9.4% in total. But there are three unusually large influences that are impacting this number, providing a big boost to the headline earnings number.
From Chada:
…The massive increase in Energy earnings (+10.5 percentage point boost to S&P 500 growth); the return to profitability for the pandemic-impacted companies (+2pp); and the drag from banks provisioning for loan losses (-4pp).
Excluding the impact of these three items, underlying earnings growth for the rest of the S&P 500 is only at a modest 1.2% year-on-year.
By this comparison, when adjusting for seasonality, Binka says that Q2 earnings are (emphasis added):
…On track to fall sharply by -4.5% quarter-on-quarter, one of the steepest declines over the last decade, comparable to those seen in the early stages of the pandemic.
Why are investors cheering this?
Keep in mind, there’s more economic slowing that needs to happen, according to the Fed. In other words, this sharp earnings decline isn’t done.
***And what about the notion that we’re about to break the back of inflation, meaning the Fed will slow down its rate hikes?
The new CPI number comes out on August 10. It’s widely expected to be lower than our last reading of 9.1%.
In all likelihood, that will reflect the huge drop in oil prices over the last month that happened when fears of a global recession led to a selloff.
But will this mean inflation is conquered?
Forget oil prices; that’s what the Fed does! Core inflation, which doesn’t factor in food or gas prices, is still either rising or hanging around at historical levels, depending on how you want to interpret the data.
From last Friday in CNBC:
Excluding food and energy, so-called core PCE increased 4.8% from a year ago, up one-tenth of a percentage point from May but off the recent high of 5.3% hit in February.
On a monthly basis, core was up 0.6%, its biggest monthly gain since April 2021.
Both core readings were 0.1 percentage point above the Dow Jones estimates.
Beyond these numbers, three days ago, Fed President Neel Kashkari said the state of inflation remains “very concerning” and it’s “spreading out more broadly across the economy.”
From Kashkari:
We keep getting inflation readings, new data that comes in as recently as this past week, and we keep getting surprised. It’s higher than we expect.
And it’s not just a few categories. It’s spreading out more broadly across the economy and that’s why the Federal Reserve is acting with such urgency to get it under control and bring it back down.
***Plus, keep in mind that just as a bear market doesn’t go down in a straight line, neither do inflation readings
They can have their own pump-fakes.
On this note, we should keep in mind commentary from Richard Curtin, the University of Michigan professor who has directed the widely-referenced University of Michigan Consumer Sentiment surveys since 1976.
When comparing the inflation of the 1970s with that of today, Curtin concluded:
Another critical characteristic of the earlier inflation era was frequent temporary reversals in inflation, only to be followed by new peaks.
That same pattern should be expected in the months ahead.
And if you listen to recent Fed President commentary, little of it suggests the Fed is ready to take its foot off the gas pedal. Here are three such recent illustrations.
From St. Louis’ James Bullard:
I think that inflation has come in hotter than what I would have expected during the second quarter. Now that that has happened, I think we’re going to have to go a little bit higher than what I said before.
From San Francisco’s Mary Daly:
[The Fed is] nowhere near almost done. We have made a good start and I feel really pleased with where we’ve gotten to at this point, [but] people are still struggling with the higher prices. My modal outlook, or the outlook I think is most likely, is really that we raise interest rates and then we hold them there for a while at whatever level we think is appropriate.
From Cleveland’s Loretta Mester:
We have more work to do because we have not seen that turn in inflation. It’s got to be a sustained, several months of evidence that inflation has first peaked – we haven’t even seen that yet – and that it’s moving down.
Based on these comments, what’s the rationale in believing the Fed is ready to declare victory over inflation and start easing?
To be clear, I think that will eventually happen, but now?
***Finally, what about some encouraging economic data?
We’ll keep this point short.
Yes, there is some encouraging economic data out there. There’s also some discouraging economic data. The reality is it’s mixed today.
So, consider this…
When most of the economic data is good, what does that suggest? Well, it typically represents a healthy economy that’s trending in the right direction.
When most of the economic data is bad, what does that suggest? A struggling economy that’s trending in the wrong direction.
And what about mixed data?
That typically happens at an economic inflection point, when the trend is changing direction. It’s moving from good to bad, or bad to good.
Sure, investors can latch onto certain pieces of good economic data today if desired. But doing so would ignore the broader point: Mixed economic data suggests a trend-change – or at best, a slowdown of the current, dominant trend.
Yes, it’s possible the economy will find its footing and get back into a healthy, bullish trend. But let’s be honest that current, mixed data is, in itself, not a positive sign.
***So, what then is behind this great rally?
Sentiment.
Investors oscillate between fear and greed.
Going into June, extreme fear ruled the day. We were seeing the worst sentiment readings in decades. But that degree of fear and pessimism is unsustainable. It has to be released.
Today, we’re seeing it released…and then some. The pendulum is swinging the other way.
Now, is the degree of bullishness we’re seeing today as irrational as the bearishness that brought us to recent lows?
No, but the excitement does seem to have gotten a bit ahead of today’s economic reality, based on the points we’ve made in this Digest.
***But as always, let’s be clear about what this means and doesn’t mean
Regular Digest readers know that we don’t try to time the bottom. It’s a fool’s errand.
We believe the wiser approach is to ask: “Is today’s price one at which I’m likely to make great returns, say, three years from today?”
If the answer is “yes,” then buying is a wise idea – even if prices head lower after your purchase.
We believe today is offering attractive entry prices on top-tier stocks for investors with longer timeframes – and, again, that’s even with the possibility of lower prices in our future.
But because we might be in a bear market rally, the difference is this:
Be wise about how much you’re buying today. Dollar-cost-averaging has been shown to be an effective way to help cautious investors get into dicey markets, enabling them to enjoy great long-term gains.
Bottom line: It’s reasonable to be doing some buying today. Just be carefully before cannonballing into this market.
At least, that’s the advice I think Terrence Jones would offer.
Have a good evening,
Jeff Remsburg