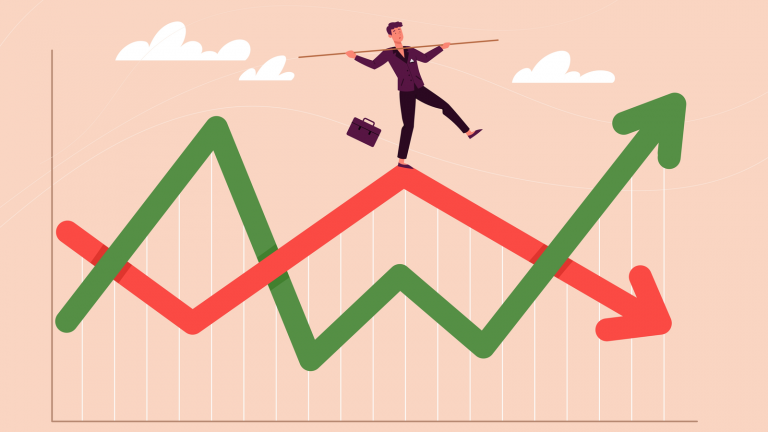
The CBOE Volatility Index (VIX) has been plummeting lower, now trading near $18. With the decline in the VIX index today, it’s now down 4% on the session. In a twist of irony, this is the lowest reading it has given since Jan. 13, 2022 — exactly one year ago.
Equities were mixed on Friday, as the S&P 500 and SPDR S&P 500 ETF Trust (NYSEARCA:SPY) are about flat. An in-line inflation report on Thursday left stock markets slightly higher. However, bank earnings on Friday morning had the indices lower to start the day.
Meanwhile, the VIX tumbled more than 10% on Thursday and is down more than 16% so far for the week.
The fall likely has some investors looking for a continued rally in the stock market. Commonly referred to as the fear gauge, the decline in the VIX translates to a “decline in fear” for many investors, which translates to “higher stock prices.”
What it actually means is that investors expect a decline in volatility over the next 30 days based on SPX options pricing.
The VIX should not be an end-all, be-all indicator for investors. As we broke down yesterday, the VIX is simply a tool to incorporate into one’s overall market assessment. According to the CBOE:
“The VIX Index measures the level of expected volatility of the S&P 500 Index over the next 30 days that is implied in the bid/ask quotations of SPX options. Thus, the VIX Index is a forward looking measure, in contrast to realized (or actual) volatility, which measures the variability of historical (or known) prices.”
In other words, “the VIX Index is intended to provide an instantaneous measure of how much the market thinks the S&P 500 Index will fluctuate in the 30 days from the time of each tick of the VIX Index.”
Does the Fall in the VIX Index Today Mean Stock Rally Tomorrow?
While a rising stock market tends to correlate with a falling VIX, the two assets don’t have a direct correlation. Instead, it has more to do with how wide the trading ranges are and what the SPX options market is doing.
For instance, it’s possible for the VIX and S&P 500 to both fall on any given day. Conversely, it’s possible for both to rally as they did on Wednesday, when the VIX rallied 2.5% and the S&P 500 climbed 1.25%.
Admittedly, it’s odd to see the VIX so calm in what many still consider a bear market, particularly as a potential recession looms in the distance. In that sense, many investors will argue that a continued rally in the stock market will likely lead to a further fall in the VIX.
That said, many argue we have not yet seen the bottom in the S&P 500 for this bear market. Part of that thesis rests on the VIX. A recent article reads: “the VIX is a reliable indicator of market capitulation and, therefore, useful for determining whether the bear market has come to an end.”
Further, it suggests that “spikes ‘in volatility have on average come at the same time as the trough in the market,’ they conclude that the bear market has not yet hit bottom.”
On the date of publication, Bret Kenwell did not have (either directly or indirectly) any positions in the securities mentioned in this article. The opinions expressed in this article are those of the writer, subject to the InvestorPlace.com Publishing Guidelines.

