A “buy schedule” from Luke Lango for taking advantage of this selloff … what Eric Fry sees coming for the AI sector … mortgage rates climb above 7% … housing prices and inflation in 2024
In our July 31st Digest, we wrote:
The market needs a breather.
Don’t be surprised when you see it, but don’t confuse it with the end of this bull run.
The very next day, the S&P began falling, with the declines now turning into a 5% correction here in August (though the Nasdaq had a huge day today, adding more than 1.5%).
To be clear, this type of pullback is not unusual. And it does not mean the bullishness we’ve seen for most of the year is over.
Yes, today’s garden variety correction could pick up steam, but that shouldn’t be the assumption. It’s certainly not Luke Lango’s assumption.
For newer Digest readers, Luke is our hypergrowth expert. While most money managers came into 2023 bearish and on the sidelines, Luke was an outspoken bull. It has certainly paid off for his subscribers as Luke’s tech/AI-heavy positioning has boosted portfolios throughout the year.
Despite his bullishness, a few weeks ago, Luke also called for this market correction:
Things are a bit frothy in the market. So, I do think we’re due for a short-term pullback of some sort.
I think that if I had my best guess, that pullback would be about 3% – to 5% at the index level.
But now that the market has dropped, Luke is seeing the opportunity to buy into tomorrow’s tech/AI leaders at heavily discounted prices.
Better yet, he just gave away the roadmap for how to do it.
Last week, in Luke’s Innovation Investor Daily Notes, Luke provided a “buy schedule” for the S&P and the Nasdaq
Here’s Luke with more details:
Recent volatility will pass – but not without offering some fantastic buying opportunities…
Still, timing the bottom is an imperfect science. Therefore, we are emphasizing a “roll-into-the-dip” approach, wherein investors patiently and selectively roll into recent stock market weakness over time and at critical technical support levels.
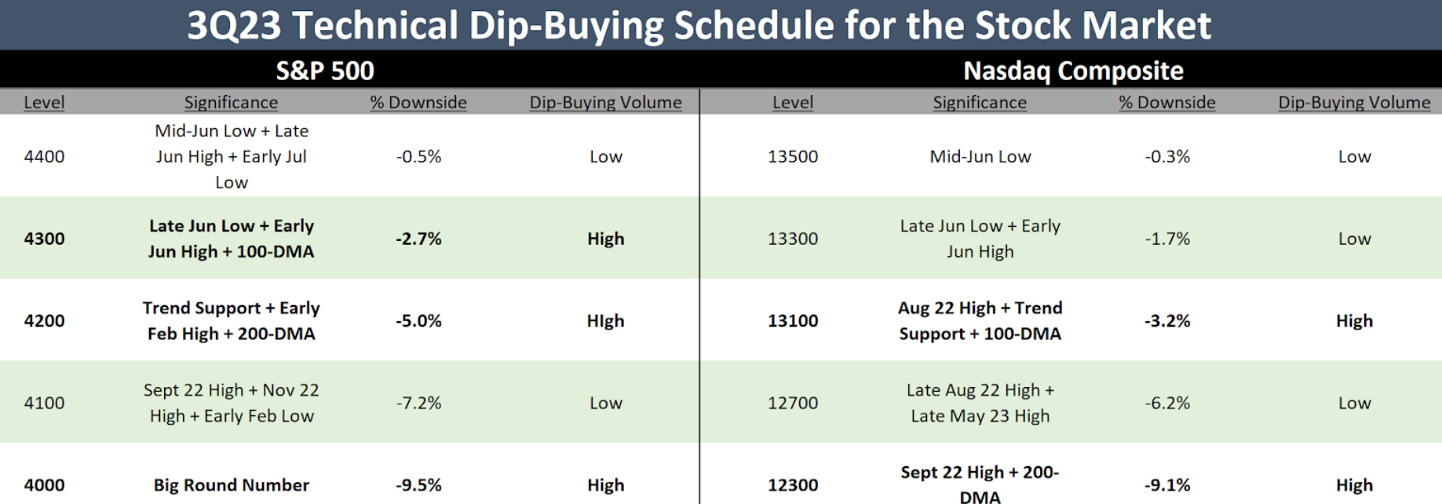
To help investors with this gradual buy approach, Luke and his team created a “technical dip-buying schedule.” It identifies the levels that could serve as local bottoms (which means good buying opportunities) for the S&P 500 and Nasdaq.
Below is that schedule:
If you’re having trouble reading it, the high-conviction buy levels for the S&P are 4,300, 4,200, and 4,000.
For the Nasdaq, they’re 13,100 and 12,300.
Here’s Luke with more:
This schedule is not a hard rule. Rather, it is a guideline for us as we navigate current market volatility and look for buying opportunities…
…Some of these levels are weaker than others, and therefore, our dip-buying efforts will likely have different magnitudes at different times.
At some levels, we will nibble. At others, we will gobble. And we will continue to focus on buying laggards, short-squeeze contenders, and reasonably valued AI stocks…
But by employing this dip-buying schedule and rolling into this selloff, we believe we are putting ourselves in the best position possible to turn today’s weakness into significant profit by the end of the year.
While buying during recent weakness probably feels a bit uncomfortable, I’m reminded of a quote from billionaire Rob Arnott, founder and chairman of the board of Research Affiliates:
In investing, what is comfortable is rarely profitable.
Here’s Luke’s take:
Overall, we’re staying on the offensive amid this continuing stock market selloff…
Don’t head for the hills or duck for cover. This is buying time.
How did we achieve such huge returns so far in 2023? We were aggressive during the stock market selloffs of late 2022 and February 2023.
And we will remain aggressive during the current selloff, too.
And by doing so, we believe we are putting ourselves in the best position possible to see huge returns between now and the end of the year.
Our macro expert Eric Fry also is buying right now, zeroing in on AI opportunities
Last week, Eric held a live event that dove into the current state of AI investing. The evening covered lots of ground but focused on a specific event happening this Wednesday that’s going to shake up the sector, resulting in a “$3 trillion panic.”
But it’s not all bad news. In fact, Eric sees a new wave of AI opportunities related to this event, though he was quick to warn attendees not to blindly buy any AI stock.
From Eric:
[What’s happening this Wednesday] is not going to impact the whole tech sector. So, that’s why if you just buy AI stocks you’re hearing about in the media, you’re speculating when you don’t have to.
To help investors, he’s providing his own “AI blueprint” for how to turn the coming panic into what he believes could be a 1,000% investment opportunity.
If you missed last week’s event and want to know more about what’s happening this Wednesday, we have a free replay available for your right here.
Finally, mortgage rates just notched a 21-year high
R.I.P., housing affordability.
Last week, the average 30-year fixed-rate mortgage hit 7.09%, the highest level since 2002.
As we’ve covered in the Digest, snowballing housing unaffordability has resulted in a few tack-on effects here in 2023:
- Would-be homeowners can’t afford to buy with such nosebleed financing costs.
- Existing homeowners don’t want to sell their homes that are currently financed at ~3% mortgage rates.
- With few people able to buy and willing to sell, existing home sales have dropped off a cliff.
- Without greater demand under these conditions, home prices remain near record highs.
According to the National Association of Realtor, in June alone, existing home sales tanked almost 20% from a year ago. Meanwhile, June’s median price of an existing home was $410,200. That’s the second most expensive price ever – second only to last year’s high of $413,800.
Don’t expect relief.
Here’s The New York Times:
…Experts do not think the housing market will cool off anytime soon.
[Last] Tuesday, Goldman Sachs revised upward its forecast for home prices, predicting a 1.8 percent rise in prices this year and 3.5 percent jump in 2024.
“Affordability remains burdensome,” analysts at the bank said in a report, citing a tighter housing supply and a steady demand for homes.
Keep in mind how these surging prices will affect future inflation reports, the Fed, and potentially, the market
Housing/shelter costs are by far the heaviest weighting in the Consumer Price Index (CPI), with the Federal Reserve Bank of Boston putting the number at 42% of the core CPI. It’s also the heaviest weighting in the Personal Consumption Expenditures Index (PCE), coming in at about 22%.
But there’s a big problem…
Real-time changes in housing/shelter prices don’t immediately show up in these reports.
From Barron’s:
Rent is critical to the CPI, but the methodology involved means the Fed is perpetually looking backward…
…The CPI is always significantly lagged. Some economists estimate that lag to be around 12 months.
So, let’s track the breadcrumbs…
The biggest macro driver of your portfolio today is the Fed’s interest rate policy…
The Fed’s interest rate policy is determined by the data…
The data – specifically, the Consumer Price Index and Personal Consumption Expenditures Index – will be most influenced by housing/shelter costs…
So, if we want to take a stab at your coming portfolio value, we need to look at what’s coming for housing/shelter prices.
And what is that?
Well, it’s a tale of two periods thanks to the lag-time that Barron’s just noted…
As you can see below in a review of the S&P/Case-Shiller U.S. National Home Price Index, we saw some relief in prices between June 2022 and January 2023. But since then, prices have been rising, and are nearly back to all-time highs.

Consider the complicating impact of this lag time for the Fed
If we’re on a one-year delay, then we’re looking at cooling inflation reports all the way through January of 2024.
Hooray! Prepare for more “inflation is toast” commentary from various talking heads.
But perhaps the more complete response should be “hooray!” followed by “uh oh!”
As I write, the first month during which traders believe we’ll see an elevated probability of the first rate-cut is next March. Those odds come in at roughly 40% (the odds of a December rate-cut come in at just 17% and there’s no February FOMC meeting).
But given this housing delay, it’s likely that CPI and PCE inflation will be rising by then because we’ll be two months into the upslope of higher housing/shelter costs.
To what extent might that slow down the Fed? Have traders priced in this potential inflation resurgence to their expected rate cuts?
Keep in mind, the big banks are now betting on lots of cuts next year. For example, Goldman Sachs just penciled a 25-basis-point cut every quarter in 2024 (though the timing of those cumulative cuts is up in the air).
What happens if the Fed’s actions don’t align with the market’s expectations?
As we pointed out in the Digest last week, we’re entering an economic climate in which it’s no longer clear what the Fed will do. That creates conditions in which there might be big disappointments between market expectations and Fed reality.
And do you know what moves stock prices in the short-term? Misalignments of expectation and reality.
It’ll be fascinating to watch how this housing data plays out.
For now, continue riding this bullishness higher, but keep an eye on what’s coming and what it could mean for tomorrow’s market conditions.
Have a good evening,
Jeff Remsburg