The need to sharpen your trading skills … what’s the latest with Coke’s recent selloff? … how XLU, DG, and O look today … the sector Louis Navellier calls “a lock” … solid, fast trading profits with AI
Today, let’s make some money.
Let me contextualize for newer Digest readers, then we’ll jump straight into the details.
For months, we’ve urged readers to hone their trading chops. We believe the turbulent market environment we’re entering favors shorter-term opportunistic trading gains more so than a buy-and-hold approach.
It’s a new epoch of market conditions. In many ways, we’re seeing a complete reversal of the bullish halcyon days of the last four decades.
Instead of falling treasury yields, we’re now watching what appears to be a new, long-term ascent…
Instead of trade/supply-chain efficiencies from globalization, we’re now rapidly moving toward deglobalization…
Instead of low interest rates, we’re grappling with “higher for longer” …
Instead of “leveraging up,” we’re witnessing frantic corporate deleveraging …
And though government spending has been careless for decades, the last few years have witnessed a tsunami of spending so reckless and unsustainable that its scope is mindboggling…
Put it all together, and we believe that opportunistic trading is a “must have” skill for investors moving forward.
In our October 9th Digest, we put a few trades on your radar. Today, let’s revisit them as we continue honing our trading chops.
Better yet, we’ll then detail a new trading opportunity that legendary investor Louis Navellier just called a “lock.”
Let’s jump in.
A refresh on the indicators we’re analyzing and what they’re telling us about Coca Cola today
The first stock we considered as a potential trade last week was Coca Cola (KO). Before we jump into what’s happened, let’s all get on the same page.
Two indicators that we used in last week’s analysis were the Relative Strength Index (RSI) and the MACD (“moving average convergence/divergence”).
As a refresh, the RSI is a momentum indicator that measures the extent to which an asset is overbought or oversold. A reading over 70 suggests an asset is “overbought” (and likely poised to pull back as buying pressure wanes) while a reading below 30 means it’s “oversold” (and poised to climb as bargain-hunters step in to buy).
The MACD reflects changes in a price trend’s strength, direction, momentum, and duration. Traders use this tool by analyzing the location of the MACD line relative to its signal line. Simplistically, if the MACD crosses above the signal line, it’s considered a bullish crossover, and potentially a buy signal. The opposite is true as well.
On Monday the 9th, both KO’s RSI and MACD readings were deeply oversold – cue our interest in a mean-reversion rally.
However, both indicators were still angling south, and KO’s price action didn’t give us confidence that buyers were helping put in a floor yet. So, our conclusion was that we wanted more evidence of a reversal before jumping into a trade.
Here’s how KO’s chart looked at the time.

So, where is Coke today?
As I write Wednesday morning, it’s up 2.3% since we profiled it back on the 9th. More importantly, we’re seeing signs of the reversal we wanted in our technical chart.
Does this mean a green light for a KO trade today?
Below is KO’s three-month chart.
We’ll present it first without commentary. See what the charts appear to be telling you, then we’ll circle back with our take.
How does it look to you?
To us, Coke appears 95% ready for a trade. And if you’re more aggressive, it’s not unreasonable to jump in before that last 5% plays out.
First, KO’s RSI level has climbed out of overbought conditions, and has reached 43. Bullish.
Second, the MACD has just completed a bullish crossover above its signal line. Better still, this happened at a level far below the zero line. Very bullish.
Finally, on the price chart itself, we’re seeing KO carving out a base. And we’re seeing our first “higher high” and “higher low” (we’re ignoring the first tiny high after KO’s bottom).
The reason we’re at “95%” instead of “100%” is because we typically look for two instances of these higher highs and higher lows to establish a new trendline (three total points, including the low-point). So, we’re close, but not quite there.
That said, if you’re comfortable with this price chart, now is a reasonable time to initiate a trade. But if you do, be prepared for KO to trade slightly underwater as it continues saw-toothing higher.
What about the other trade set-ups we were considering last week?
Jumping through them quickly, XLU is up nearly 4%, and while the MACD still appears healthy, the RSI (which is more sensitive) appears to be stalling out. However, if you’re in the trade, this isn’t enough to warrant getting out.
Dollar General has popped 13%. Here again, we see a strong MACD but a sideways RSI.
Also, after such a surge, you usually want to prepare yourself for some short-term weakness as traders take profits. We could see some short-term weakness over the next few days.
And Realty Income has climbed nearly 1%. Here, the MACD is strong, though it appears the slope has just begun to flatten.
Meanwhile, the RSI has already begun angling south. And I’d be watching resistance at 51, which is where Realty has had trouble pushing through since earlier this month.
Louis Navellier’s “lock” trade today
Let’s now jump to the trading opportunity that has legendary investor Louis Navellier excited. To set the stage, let’s go to his Flash Alert podcast from Growth Investor
yesterday.
After providing updates about the latest developments in the war between Israel and Hamas, along with the growing U.S. military presence in the region, Louis arrives at the takeaway:
Energy is a lock right now. It’s an absolute lock.
Bloomberg came out with an article [yesterday] saying that there’s just not enough natural gas in the world to make the green transition…
So, that’s great for all our natural gas related stocks.
And we’re in an El Niño now. El Niño is supposed to trigger a cold winter…
So, natural gas looks great. Refineries look great. Integrated oil looks great.
Louis’ analysis gives us plenty to choose from within the broad energy market, and we encourage you to do your own analysis, but let’s highlight just one top-shelf natural gas play – EQT.
EQT is the largest U.S. natural gas producer with operations in the Marcellus and Utica shales of the Appalachian Basin. So, if natural gas is a lock, EQT will benefit.
Given Louis’ sector bullishness, what we’re looking for isn’t so much the deeply oversold conditions that alerted us to our trades above. Instead, we just want to see signs of health with room for gains. Most importantly, we’re checking for entry timing.
Here’s EQT’s six-month chart. See what you think, then we’ll circle back.
Our RSI level is at 59. While that’s not a negative, it appears it’s lost some bullish momentum over the last week-and-a-half. This gives us pause.
The MACD is strong, well above its signal line, yet it appears its slope is leveling off. Another reason for pause.
As to the price action, though EQT suffered a steep selloff in September, it bounced back quickly – that’s bullish. However, it looks like we’re seeing heavy resistance at the $44.50 level.
If you look again at the chart, you can see multiple failed attempts to push through this resistance level since last month.
So, from a trading perspective, we’d likely not jump into EQT just yet.
Given Louis’ sector bullishness, our issue isn’t the trade itself, just its timing. We’d want to see EQT breakout above this $44.50 level with the RSI and MACD charts showing us renewed strength on strong volume. That’s when we’d hop in.
We’ll circle back in the weeks to come to see how plays out.
Speaking of energy trades, just this morning Louis’ Predictive Alpha AI system in AI Advantage flagged two energy trades
And yesterday, they locked in a 9.5% return on a different trade…in just five trading days.
While 9.5% certainly isn’t the biggest gain you’ve seen us highlight from Louis in the Digest, the speed of this gain is what’s unique. It’s a feature of Louis’ new AI-based trading service.
Here’s Louis to explain:
In today’s market, I know that many of my readers want cash now. So, that’s exactly what we’ll be doing.
We’ll make short-term trades and trade every week and then watch these gains accumulate – through bull or bear markets.
The service combines the heart of Louis’ multi-decade market approach – fundamentally superior stocks – with AI-based short-term trading signals. The AI predicts where stocks will be trading 21 trading days into the future with 82% accuracy.
By “stacking” a progression of small wins, it can quickly snowball into a massive portfolio value over the months.
Back to Louis:
A.I. will be the future of personal investing. If you’re not using this strategy every 21 trading days, you’ll be smoked by the people who are – especially in today’s historically choppy market.
Louis has been dripping out live trades all week to show subscribers how powerful and accurate the system is. But let me show you the evidence right now.
Here are the five current trades in AI Advantage, all launched last Thursday – less than one week ago.
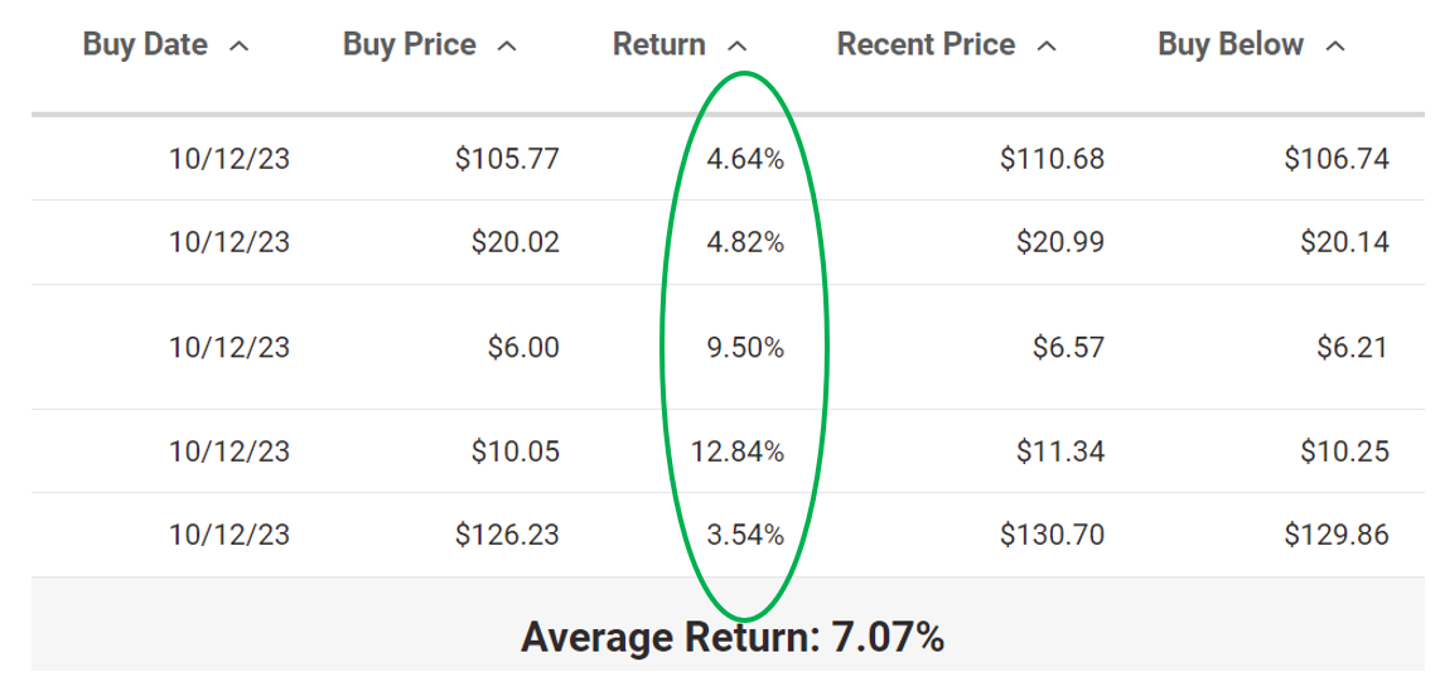
I’ll point out that the S&P is down 0.89% as I write over this period, yet you can see that Louis’ average gain is more than 7%.
You can learn more about AI Advantage and get on Louis’ recipient list right here.
Coming full circle, our recommendation remains…
Please sharpen your trading chops.
We’re entering a different market environment that favors shorter-term, opportunistic trading.
So, whether by partnering with Louis in AI Advantage, or by becoming effective at using technical indicators, your ability to pull trading profits out of the market is increasingly important.
It doesn’t have to replace buy-and-hold, but trading could be a critical means of generating gains if buy-and-hold stumbles in the months ahead.
Have a good evening,
Jeff Remsburg