The ongoing meltdown in crude oil has been a wonder to behold. The bloodbath in black gold intensified Friday as the struggling commodity swooned some 10% on the day. Not surprisingly, the Energy Select Sector SPDR (ETF) (XLE) followed suit, dropping just over 6%.
With the vultures circling and overly pessimistic price forecasts multiplying, my inner contrarian is starting to perk up.
The objective of a contrarian on Wall Street is to fade the crowd or bet against the consensus. Such an endeavor is easier said than done, however, as the crowd is the market the majority of the time. And yet, when a price move has become so entrenched that all onlookers agree its continuation is all but guaranteed, the stock in question is usually ripe for a reversal.
Crude oil seems to be in just such a position.
At the lows on Monday, oil was down more than 40% from its high of $107 reached in the summer. While the slide may continue unabated, I’m skeptical. Even the most vicious bear markets are punctuated by the occasional rebound.
Click to Enlarge
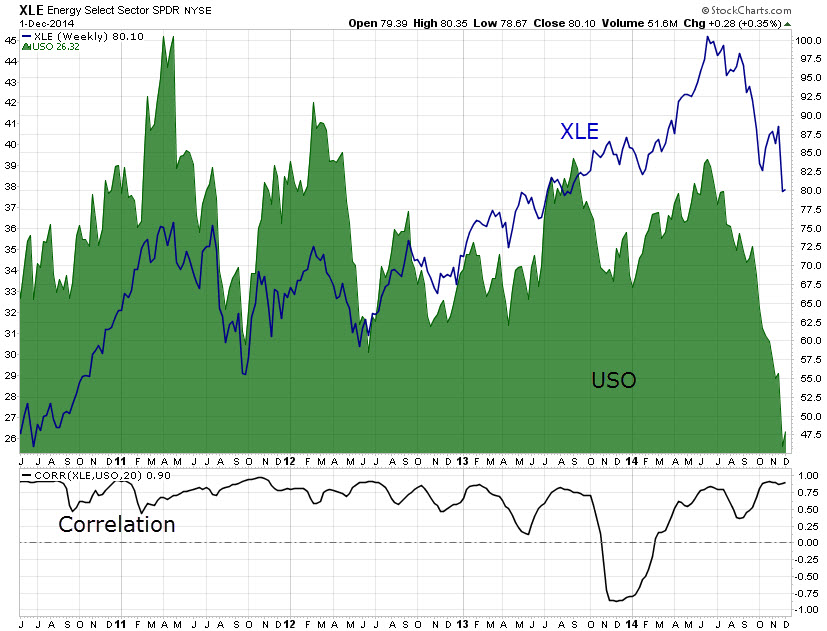
The correlation between oil and XLE is quite pronounced. To quantify their relationship, we can use a correlation study.
In the chart to the right, the XLE ETF is represented by the blue line, while the United States Oil Fund LP (ETF) (USO) is shown as a green area chart. For those otherwise unfamiliar, USO is the world’s most popular oil ETF and does a decent job of mimicking the movements of West Texas Intermediate light, sweet crude oil.
As shown in the bottom panel, the weekly correlation of both ETFs stands at 0.89. Though a perfect positive correlation would have been 1, the reading of 0.89 is close enough to give us confidence that any type of rebound in oil would be accompanied by a bounce in XLE.
XLE: How to Play Energy Stocks Now
The beauty of the options market is that we have a number of high-probability strategies to exploit some type of rebound in XLE. To hedge our bets, we could even structure a play that wins even if energy stocks keep dropping, just as long as the decline slows in the coming weeks.
Sell the Jan $75/$70 bull put spread by simultaneously selling the Jan $75 put and buying the Jan $70 put for 85 cents. The reward is limited to the initial credit received and will be captured provided XLE sits above $75 at January expiration. The max risk is limited to the distance between strikes minus the net credit, or $4.15, and will be lost if XLE falls below $70 by expiration.
As of this writing, Tyler Craig did not hold a position in any of the aforementioned securities.